Spaniard vs Bermudan Family Households
COMPARE
Spaniard
Bermudan
Family Households
Family Households Comparison
Spaniards
Bermudans
65.1%
FAMILY HOUSEHOLDS
97.8/ 100
METRIC RATING
104th/ 347
METRIC RANK
62.2%
FAMILY HOUSEHOLDS
0.0/ 100
METRIC RATING
305th/ 347
METRIC RANK
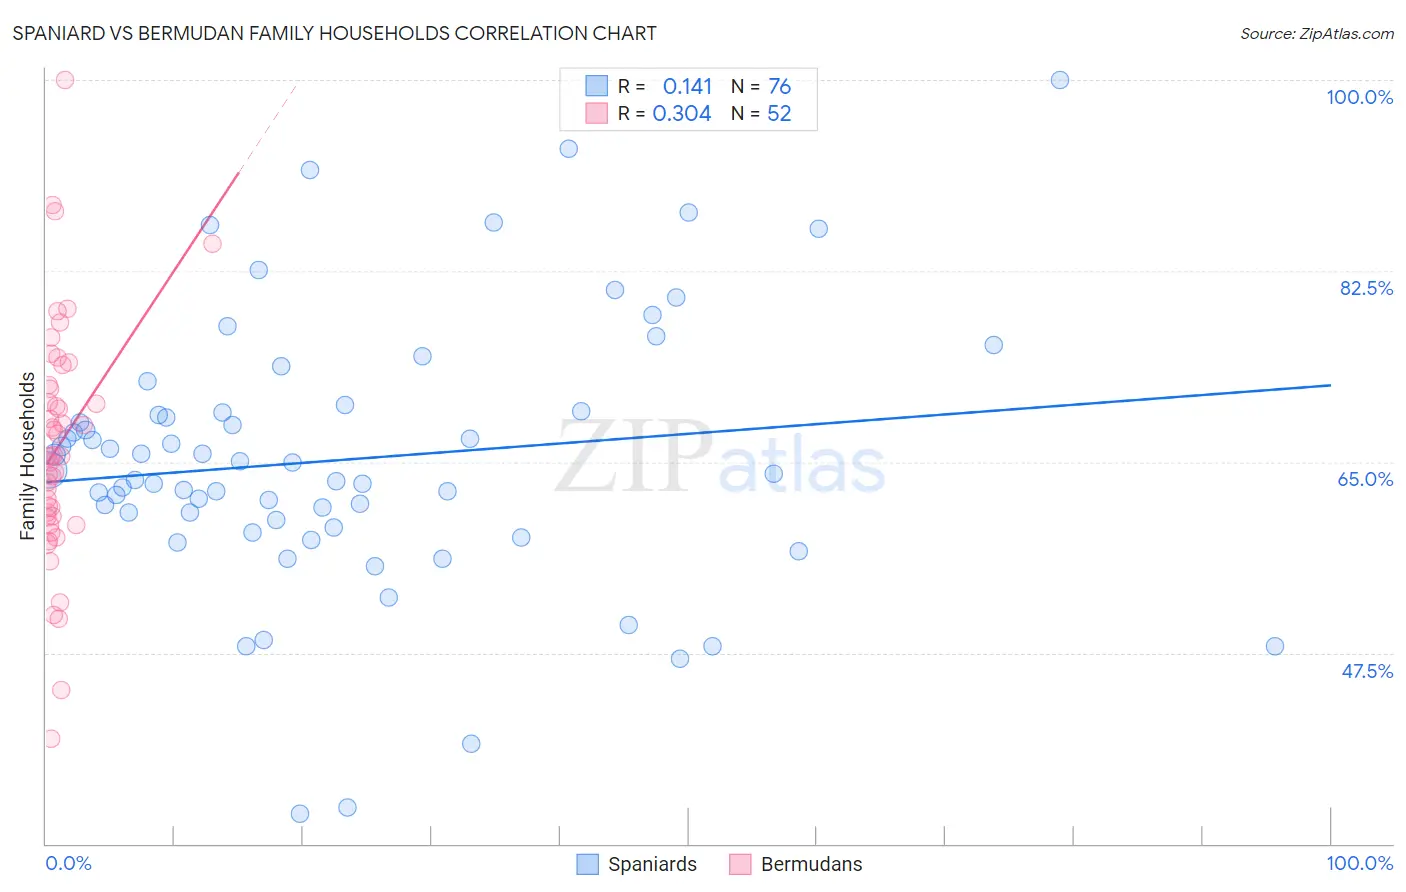
Spaniard vs Bermudan Family Households Correlation Chart
The statistical analysis conducted on geographies consisting of 443,170,610 people shows a poor positive correlation between the proportion of Spaniards and percentage of family households in the United States with a correlation coefficient (R) of 0.141 and weighted average of 65.1%. Similarly, the statistical analysis conducted on geographies consisting of 55,716,623 people shows a mild positive correlation between the proportion of Bermudans and percentage of family households in the United States with a correlation coefficient (R) of 0.304 and weighted average of 62.2%, a difference of 4.8%.
Family Households Correlation Summary
| Measurement | Spaniard | Bermudan |
| Minimum | 32.8% | 39.6% |
| Maximum | 100.0% | 100.0% |
| Range | 67.2% | 60.4% |
| Mean | 65.2% | 66.5% |
| Median | 64.1% | 65.5% |
| Interquartile 25% (IQ1) | 59.3% | 59.9% |
| Interquartile 75% (IQ3) | 69.6% | 71.8% |
| Interquartile Range (IQR) | 10.3% | 11.9% |
| Standard Deviation (Sample) | 12.5% | 10.9% |
| Standard Deviation (Population) | 12.4% | 10.8% |
Similar Demographics by Family Households
Demographics Similar to Spaniards by Family Households
In terms of family households, the demographic groups most similar to Spaniards are Indian (Asian) (65.1%, a difference of 0.010%), Immigrants from Sri Lanka (65.1%, a difference of 0.020%), Haitian (65.2%, a difference of 0.040%), Chilean (65.2%, a difference of 0.040%), and English (65.1%, a difference of 0.070%).
| Demographics | Rating | Rank | Family Households |
| Guatemalans | 98.6 /100 | #97 | Exceptional 65.2% |
| Immigrants | Syria | 98.4 /100 | #98 | Exceptional 65.2% |
| Central American Indians | 98.3 /100 | #99 | Exceptional 65.2% |
| Haitians | 98.1 /100 | #100 | Exceptional 65.2% |
| Chileans | 98.1 /100 | #101 | Exceptional 65.2% |
| Immigrants | Sri Lanka | 98.0 /100 | #102 | Exceptional 65.1% |
| Indians (Asian) | 97.9 /100 | #103 | Exceptional 65.1% |
| Spaniards | 97.8 /100 | #104 | Exceptional 65.1% |
| English | 97.4 /100 | #105 | Exceptional 65.1% |
| Whites/Caucasians | 97.3 /100 | #106 | Exceptional 65.1% |
| Alaska Natives | 97.3 /100 | #107 | Exceptional 65.1% |
| Palestinians | 97.2 /100 | #108 | Exceptional 65.1% |
| Immigrants | Guatemala | 96.9 /100 | #109 | Exceptional 65.0% |
| Scandinavians | 96.8 /100 | #110 | Exceptional 65.0% |
| Europeans | 96.8 /100 | #111 | Exceptional 65.0% |
Demographics Similar to Bermudans by Family Households
In terms of family households, the demographic groups most similar to Bermudans are African (62.1%, a difference of 0.020%), Immigrants from Norway (62.1%, a difference of 0.10%), Chippewa (62.1%, a difference of 0.10%), Iroquois (62.2%, a difference of 0.15%), and Subsaharan African (62.1%, a difference of 0.16%).
| Demographics | Rating | Rank | Family Households |
| Immigrants | Spain | 0.0 /100 | #298 | Tragic 62.4% |
| Immigrants | Kuwait | 0.0 /100 | #299 | Tragic 62.4% |
| Immigrants | Africa | 0.0 /100 | #300 | Tragic 62.4% |
| Immigrants | Albania | 0.0 /100 | #301 | Tragic 62.4% |
| Immigrants | Kenya | 0.0 /100 | #302 | Tragic 62.3% |
| Cree | 0.0 /100 | #303 | Tragic 62.3% |
| Iroquois | 0.0 /100 | #304 | Tragic 62.2% |
| Bermudans | 0.0 /100 | #305 | Tragic 62.2% |
| Africans | 0.0 /100 | #306 | Tragic 62.1% |
| Immigrants | Norway | 0.0 /100 | #307 | Tragic 62.1% |
| Chippewa | 0.0 /100 | #308 | Tragic 62.1% |
| Sub-Saharan Africans | 0.0 /100 | #309 | Tragic 62.1% |
| Immigrants | Liberia | 0.0 /100 | #310 | Tragic 62.0% |
| Immigrants | Morocco | 0.0 /100 | #311 | Tragic 62.0% |
| Immigrants | Latvia | 0.0 /100 | #312 | Tragic 62.0% |