Immigrants from Burma/Myanmar vs Bermudan Master's Degree

COMPARE

Immigrants from Burma/Myanmar
Race
Ancestry
AfghanAfricanAlaska NativeAlaskan AthabascanAlbanianAleutAlsatianAmericanApacheArabArapahoArgentineanArmenianAssyrian/Chaldean/SyriacAustralianAustrianBahamianBangladeshiBarbadianBasqueBelgianBelizeanBhutaneseBlackfeetBolivianBrazilianBritishBritish West IndianBulgarianBurmeseCajunCambodianCanadianCape VerdeanCarpatho RusynCelticCentral AmericanCentral American IndianCherokeeCheyenneChickasawChileanChineseChippewaChoctawColombianColvilleComancheCosta RicanCreeCreekCroatianCrowCubanCypriotCzechCzechoslovakianDanishDelawareDominicanDutchDutch West IndianEastern EuropeanEcuadorianEgyptianEnglishEstonianEthiopianEuropeanFijianFilipinoFinnishFrenchFrench American IndianFrench CanadianGermanGerman RussianGhanaianGreekGuamanian/ChamorroGuatemalanGuyaneseHaitianHmongHonduranHopiHoumaHungarianIcelanderIndian (Asian)IndonesianInupiatIranianIraqiIrishIroquoisIsraeliItalianJamaicanJapaneseJordanianKenyanKiowaKoreanLaotianLatvianLebaneseLiberianLithuanianLumbeeLuxembourgerMacedonianMalaysianMalteseMarshalleseMenomineeMexicanMexican American IndianMongolianMoroccanNative HawaiianNavajoNepaleseNew ZealanderNicaraguanNigerianNorthern EuropeanNorwegianOkinawanOsageOttawaPaiutePakistaniPalestinianPanamanianParaguayanPennsylvania GermanPeruvianPimaPolishPortuguesePotawatomiPuebloPuerto RicanPuget Sound SalishRomanianRussianSalvadoranSamoanScandinavianScotch-IrishScottishSeminoleSenegaleseSerbianShoshoneSierra LeoneanSiouxSlavicSlovakSloveneSomaliSouth AfricanSouth AmericanSouth American IndianSoviet UnionSpaniardSpanishSpanish AmericanSpanish American IndianSri LankanSubsaharan AfricanSudaneseSwedishSwissSyrianTaiwaneseThaiTlingit-HaidaTohono O'OdhamTonganTrinidadian and TobagonianTsimshianTurkishU.S. Virgin IslanderUgandanUkrainianUruguayanUteVenezuelanVietnameseWelshWest IndianYakamaYaquiYugoslavianYumanYup'ikZimbabwean
Immigration
NonimmigrantsImmigrantsAfghanistanAfricaAlbaniaArgentinaArmeniaAsiaAustraliaAustriaBahamasBangladeshBarbadosBelarusBelgiumBelizeBoliviaBosnia and HerzegovinaBrazilBulgariaBurma/MyanmarCabo VerdeCambodiaCameroonCanadaCaribbeanCentral AmericaChileChinaColombiaCongoCosta RicaCroatiaCubaCzechoslovakiaDenmarkDominicaDominican RepublicEastern AfricaEastern AsiaEastern EuropeEcuadorEgyptEl SalvadorEnglandEritreaEthiopiaEuropeFijiFranceGermanyGhanaGreeceGrenadaGuatemalaGuyanaHaitiHondurasHong KongHungaryIndiaIndonesiaIranIraqIrelandIsraelItalyJamaicaJapanJordanKazakhstanKenyaKoreaKuwaitLaosLatin AmericaLatviaLebanonLiberiaLithuaniaMalaysiaMexicoMicronesiaMiddle AfricaMoldovaMoroccoNepalNetherlandsNicaraguaNigeriaNorth AmericaNorth MacedoniaNorthern AfricaNorthern EuropeNorwayOceaniaPakistanPanamaPeruPhilippinesPolandPortugalRomaniaRussiaSaudi ArabiaScotlandSenegalSerbiaSierra LeoneSingaporeSomaliaSouth AfricaSouth AmericaSouth Central AsiaSouth Eastern AsiaSouthern EuropeSpainSri LankaSt. Vincent and the GrenadinesSudanSwedenSwitzerlandSyriaTaiwanThailandTrinidad and TobagoTurkeyUgandaUkraineUruguayUzbekistanVenezuelaVietnamWest IndiesWestern AfricaWestern AsiaWestern EuropeYemenZaireZimbabweAzores
Bermudan
Race
Ancestry
AfghanAfricanAlaska NativeAlaskan AthabascanAlbanianAleutAlsatianAmericanApacheArabArapahoArgentineanArmenianAssyrian/Chaldean/SyriacAustralianAustrianBahamianBangladeshiBarbadianBasqueBelgianBelizeanBermudanBhutaneseBlackfeetBolivianBrazilianBritishBritish West IndianBulgarianBurmeseCajunCambodianCanadianCape VerdeanCarpatho RusynCelticCentral AmericanCentral American IndianCherokeeCheyenneChickasawChileanChineseChippewaChoctawColombianColvilleComancheCosta RicanCreeCreekCroatianCrowCubanCypriotCzechCzechoslovakianDanishDelawareDominicanDutchDutch West IndianEastern EuropeanEcuadorianEgyptianEnglishEstonianEthiopianEuropeanFijianFilipinoFinnishFrenchFrench American IndianFrench CanadianGermanGerman RussianGhanaianGreekGuamanian/ChamorroGuatemalanGuyaneseHaitianHmongHonduranHopiHoumaHungarianIcelanderIndian (Asian)IndonesianInupiatIranianIraqiIrishIroquoisIsraeliItalianJamaicanJapaneseJordanianKenyanKiowaKoreanLaotianLatvianLebaneseLiberianLithuanianLumbeeLuxembourgerMacedonianMalaysianMalteseMarshalleseMenomineeMexicanMexican American IndianMongolianMoroccanNative HawaiianNavajoNepaleseNew ZealanderNicaraguanNigerianNorthern EuropeanNorwegianOkinawanOsageOttawaPaiutePakistaniPalestinianPanamanianParaguayanPennsylvania GermanPeruvianPimaPolishPortuguesePotawatomiPuebloPuerto RicanPuget Sound SalishRomanianRussianSalvadoranSamoanScandinavianScotch-IrishScottishSeminoleSenegaleseSerbianShoshoneSierra LeoneanSiouxSlavicSlovakSloveneSomaliSouth AfricanSouth AmericanSouth American IndianSoviet UnionSpaniardSpanishSpanish AmericanSpanish American IndianSri LankanSubsaharan AfricanSudaneseSwedishSwissSyrianTaiwaneseThaiTlingit-HaidaTohono O'OdhamTonganTrinidadian and TobagonianTsimshianTurkishU.S. Virgin IslanderUgandanUkrainianUruguayanUteVenezuelanVietnameseWelshWest IndianYakamaYaquiYugoslavianYumanYup'ikZimbabwean
Immigration
NonimmigrantsImmigrantsAfghanistanAfricaAlbaniaArgentinaArmeniaAsiaAustraliaAustriaBahamasBangladeshBarbadosBelarusBelgiumBelizeBoliviaBosnia and HerzegovinaBrazilBulgariaCabo VerdeCambodiaCameroonCanadaCaribbeanCentral AmericaChileChinaColombiaCongoCosta RicaCroatiaCubaCzechoslovakiaDenmarkDominicaDominican RepublicEastern AfricaEastern AsiaEastern EuropeEcuadorEgyptEl SalvadorEnglandEritreaEthiopiaEuropeFijiFranceGermanyGhanaGreeceGrenadaGuatemalaGuyanaHaitiHondurasHong KongHungaryIndiaIndonesiaIranIraqIrelandIsraelItalyJamaicaJapanJordanKazakhstanKenyaKoreaKuwaitLaosLatin AmericaLatviaLebanonLiberiaLithuaniaMalaysiaMexicoMicronesiaMiddle AfricaMoldovaMoroccoNepalNetherlandsNicaraguaNigeriaNorth AmericaNorth MacedoniaNorthern AfricaNorthern EuropeNorwayOceaniaPakistanPanamaPeruPhilippinesPolandPortugalRomaniaRussiaSaudi ArabiaScotlandSenegalSerbiaSierra LeoneSingaporeSomaliaSouth AfricaSouth AmericaSouth Central AsiaSouth Eastern AsiaSouthern EuropeSpainSri LankaSt. Vincent and the GrenadinesSudanSwedenSwitzerlandSyriaTaiwanThailandTrinidad and TobagoTurkeyUgandaUkraineUruguayUzbekistanVenezuelaVietnamWest IndiesWestern AfricaWestern AsiaWestern EuropeYemenZaireZimbabweAzores
Master's Degree
Income
Poverty
Unemployment
Labor Participation
Family Structure
Vehicle Availability
Education Level
Disability

Master's Degree Comparison

Immigrants from Burma/Myanmar

Bermudans

Tragic
Good
13.5%
MASTER'S DEGREE
5.0/ 100
METRIC RATING
234th/ 347
METRIC RANK
15.4%
MASTER'S DEGREE
73.9/ 100
METRIC RATING
156th/ 347
METRIC RANK

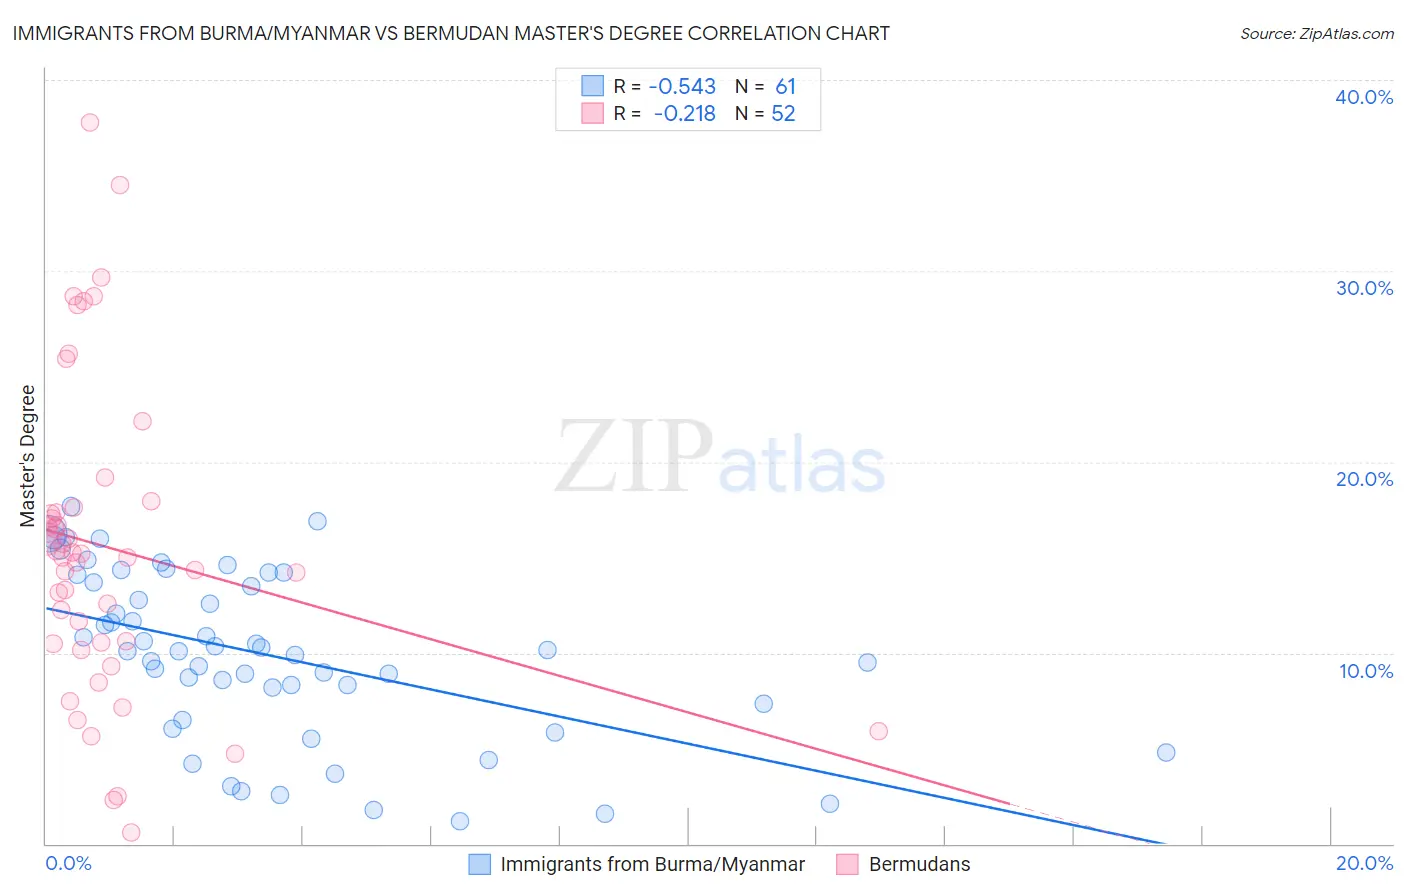
Immigrants from Burma/Myanmar vs Bermudan Master's Degree Correlation Chart

The statistical analysis conducted on geographies consisting of 172,302,674 people shows a substantial negative correlation between the proportion of Immigrants from Burma/Myanmar and percentage of population with at least master's degree education in the United States with a correlation coefficient (R) of -0.543 and weighted average of 13.5%. Similarly, the statistical analysis conducted on geographies consisting of 55,727,694 people shows a weak negative correlation between the proportion of Bermudans and percentage of population with at least master's degree education in the United States with a correlation coefficient (R) of -0.218 and weighted average of 15.4%, a difference of 14.1%.
Immigrants from Burma/Myanmar vs Bermudan Master's Degree

Master's Degree Correlation Summary

MeasurementImmigrants from Burma/MyanmarBermudan
Minimum1.2%0.60%
Maximum17.6%37.8%
Range16.5%37.2%
Mean9.9%15.5%
Median10.1%15.1%
Interquartile 25% (IQ1)6.9%10.5%
Interquartile 75% (IQ3)13.9%17.5%
Interquartile Range (IQR)7.0%7.0%
Standard Deviation (Sample)4.4%8.1%
Standard Deviation (Population)4.3%8.0%

Similar Demographics by Master's Degree

Demographics Similar to Immigrants from Burma/Myanmar by Master's Degree

In terms of master's degree, the demographic groups most similar to Immigrants from Burma/Myanmar are German Russian (13.5%, a difference of 0.41%), Immigrants from Ecuador (13.6%, a difference of 0.50%), Immigrants from Guyana (13.4%, a difference of 0.52%), Immigrants from Philippines (13.6%, a difference of 0.65%), and Jamaican (13.4%, a difference of 0.75%).
DemographicsRating | RankMaster's Degree
Immigrants | West Indies
9.8
/100
|
#227
Tragic
13.9%
Whites/Caucasians
9.1
/100
|
#228
Tragic
13.8%
British West Indians
8.8
/100
|
#229
Tragic
13.8%
Dutch
8.7
/100
|
#230
Tragic
13.8%
Guyanese
7.6
/100
|
#231
Tragic
13.7%
Immigrants | Philippines
6.0
/100
|
#232
Tragic
13.6%
Immigrants | Ecuador
5.7
/100
|
#233
Tragic
13.6%
Immigrants | Burma/Myanmar
5.0
/100
|
#234
Tragic
13.5%
German Russians
4.5
/100
|
#235
Tragic
13.5%
Immigrants | Guyana
4.4
/100
|
#236
Tragic
13.4%
Jamaicans
4.1
/100
|
#237
Tragic
13.4%
Hmong
4.0
/100
|
#238
Tragic
13.4%
Immigrants | Nonimmigrants
3.4
/100
|
#239
Tragic
13.3%
Guamanians/Chamorros
2.2
/100
|
#240
Tragic
13.1%
U.S. Virgin Islanders
2.1
/100
|
#241
Tragic
13.1%

Demographics Similar to Bermudans by Master's Degree

In terms of master's degree, the demographic groups most similar to Bermudans are Immigrants from Cameroon (15.4%, a difference of 0.35%), Immigrants from Bangladesh (15.5%, a difference of 0.36%), Immigrants from Poland (15.4%, a difference of 0.39%), Immigrants from South America (15.5%, a difference of 0.40%), and Luxembourger (15.3%, a difference of 0.45%).
DemographicsRating | RankMaster's Degree
Ghanaians
78.2
/100
|
#149
Good
15.5%
Slovenes
78.0
/100
|
#150
Good
15.5%
Iraqis
77.3
/100
|
#151
Good
15.5%
Slavs
77.0
/100
|
#152
Good
15.5%
Icelanders
76.8
/100
|
#153
Good
15.5%
Immigrants | South America
76.3
/100
|
#154
Good
15.5%
Immigrants | Bangladesh
76.1
/100
|
#155
Good
15.5%
Bermudans
73.9
/100
|
#156
Good
15.4%
Immigrants | Cameroon
71.7
/100
|
#157
Good
15.4%
Immigrants | Poland
71.5
/100
|
#158
Good
15.4%
Luxembourgers
71.0
/100
|
#159
Good
15.3%
Kenyans
70.3
/100
|
#160
Good
15.3%
Sudanese
68.7
/100
|
#161
Good
15.3%
Peruvians
68.7
/100
|
#162
Good
15.3%
Uruguayans
67.1
/100
|
#163
Good
15.3%