Somali vs Bermudan Master's Degree
COMPARE
Somali
Bermudan
Master's Degree
Master's Degree Comparison
Somalis
Bermudans
14.2%
MASTER'S DEGREE
18.0/ 100
METRIC RATING
211th/ 347
METRIC RANK
15.4%
MASTER'S DEGREE
73.9/ 100
METRIC RATING
156th/ 347
METRIC RANK
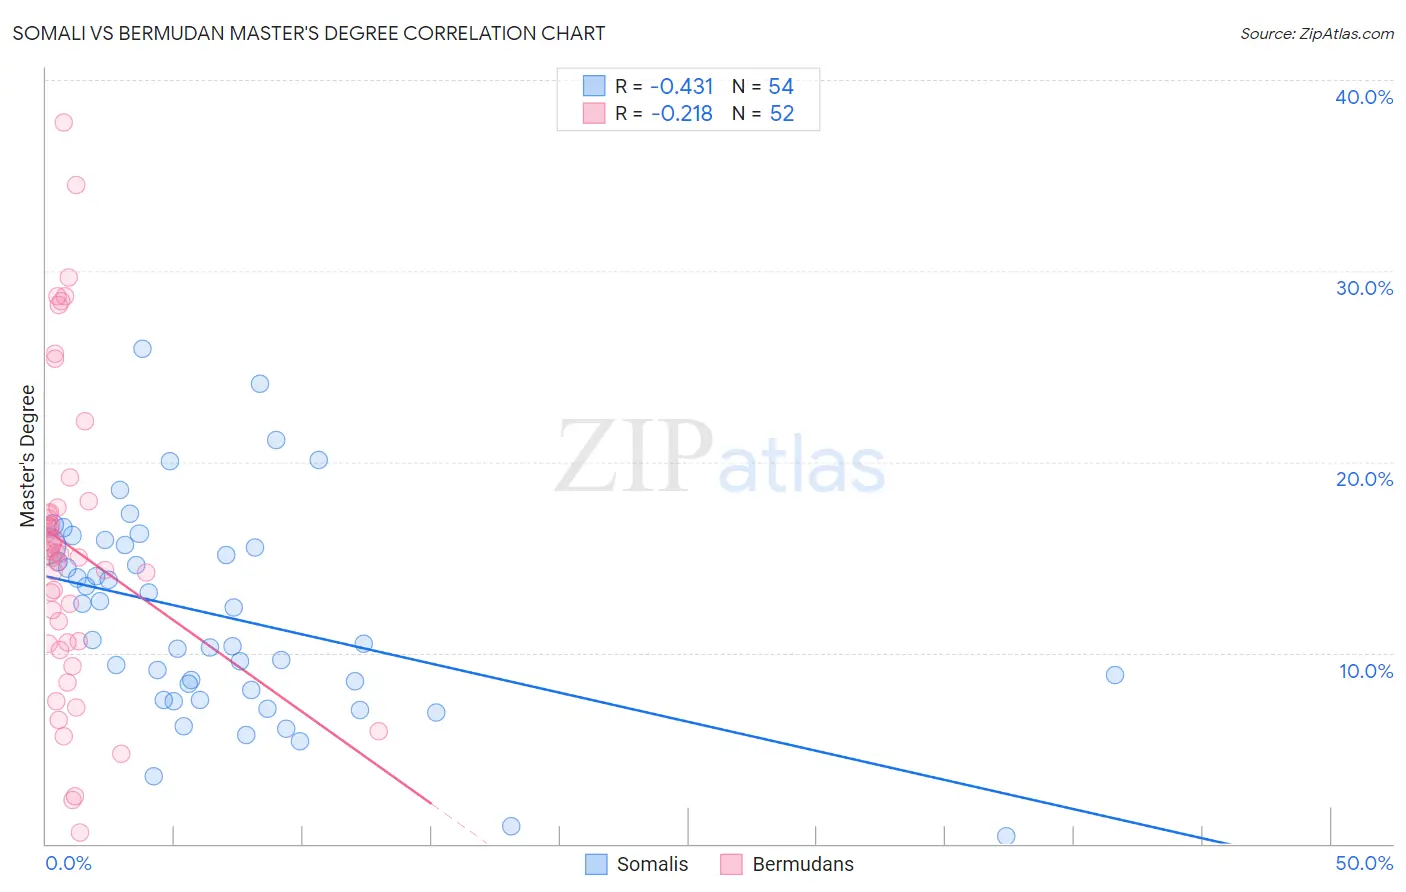
Somali vs Bermudan Master's Degree Correlation Chart
The statistical analysis conducted on geographies consisting of 99,313,729 people shows a moderate negative correlation between the proportion of Somalis and percentage of population with at least master's degree education in the United States with a correlation coefficient (R) of -0.431 and weighted average of 14.2%. Similarly, the statistical analysis conducted on geographies consisting of 55,727,694 people shows a weak negative correlation between the proportion of Bermudans and percentage of population with at least master's degree education in the United States with a correlation coefficient (R) of -0.218 and weighted average of 15.4%, a difference of 8.6%.
Master's Degree Correlation Summary
| Measurement | Somali | Bermudan |
| Minimum | 0.40% | 0.60% |
| Maximum | 25.9% | 37.8% |
| Range | 25.5% | 37.2% |
| Mean | 11.9% | 15.5% |
| Median | 11.5% | 15.1% |
| Interquartile 25% (IQ1) | 8.1% | 10.5% |
| Interquartile 75% (IQ3) | 15.6% | 17.5% |
| Interquartile Range (IQR) | 7.5% | 7.0% |
| Standard Deviation (Sample) | 5.4% | 8.1% |
| Standard Deviation (Population) | 5.3% | 8.0% |
Similar Demographics by Master's Degree
Demographics Similar to Somalis by Master's Degree
In terms of master's degree, the demographic groups most similar to Somalis are Spanish (14.2%, a difference of 0.050%), Immigrants from Thailand (14.2%, a difference of 0.24%), Finnish (14.2%, a difference of 0.25%), Subsaharan African (14.2%, a difference of 0.31%), and Immigrants from Panama (14.3%, a difference of 0.44%).
| Demographics | Rating | Rank | Master's Degree |
| French | 23.7 /100 | #204 | Fair 14.4% |
| Trinidadians and Tobagonians | 23.5 /100 | #205 | Fair 14.4% |
| Scandinavians | 23.3 /100 | #206 | Fair 14.4% |
| Immigrants | Bosnia and Herzegovina | 22.0 /100 | #207 | Fair 14.3% |
| Immigrants | Barbados | 20.5 /100 | #208 | Fair 14.3% |
| Immigrants | Panama | 20.0 /100 | #209 | Fair 14.3% |
| Sub-Saharan Africans | 19.4 /100 | #210 | Poor 14.2% |
| Somalis | 18.0 /100 | #211 | Poor 14.2% |
| Spanish | 17.8 /100 | #212 | Poor 14.2% |
| Immigrants | Thailand | 17.0 /100 | #213 | Poor 14.2% |
| Finns | 16.9 /100 | #214 | Poor 14.2% |
| Immigrants | Vietnam | 16.1 /100 | #215 | Poor 14.1% |
| Immigrants | Somalia | 15.8 /100 | #216 | Poor 14.1% |
| Immigrants | Trinidad and Tobago | 15.8 /100 | #217 | Poor 14.1% |
| French Canadians | 14.9 /100 | #218 | Poor 14.1% |
Demographics Similar to Bermudans by Master's Degree
In terms of master's degree, the demographic groups most similar to Bermudans are Immigrants from Cameroon (15.4%, a difference of 0.35%), Immigrants from Bangladesh (15.5%, a difference of 0.36%), Immigrants from Poland (15.4%, a difference of 0.39%), Immigrants from South America (15.5%, a difference of 0.40%), and Luxembourger (15.3%, a difference of 0.45%).
| Demographics | Rating | Rank | Master's Degree |
| Ghanaians | 78.2 /100 | #149 | Good 15.5% |
| Slovenes | 78.0 /100 | #150 | Good 15.5% |
| Iraqis | 77.3 /100 | #151 | Good 15.5% |
| Slavs | 77.0 /100 | #152 | Good 15.5% |
| Icelanders | 76.8 /100 | #153 | Good 15.5% |
| Immigrants | South America | 76.3 /100 | #154 | Good 15.5% |
| Immigrants | Bangladesh | 76.1 /100 | #155 | Good 15.5% |
| Bermudans | 73.9 /100 | #156 | Good 15.4% |
| Immigrants | Cameroon | 71.7 /100 | #157 | Good 15.4% |
| Immigrants | Poland | 71.5 /100 | #158 | Good 15.4% |
| Luxembourgers | 71.0 /100 | #159 | Good 15.3% |
| Kenyans | 70.3 /100 | #160 | Good 15.3% |
| Sudanese | 68.7 /100 | #161 | Good 15.3% |
| Peruvians | 68.7 /100 | #162 | Good 15.3% |
| Uruguayans | 67.1 /100 | #163 | Good 15.3% |