Immigrants from Afghanistan vs Bermudan Master's Degree
COMPARE
Immigrants from Afghanistan
Bermudan
Master's Degree
Master's Degree Comparison
Immigrants from Afghanistan
Bermudans
15.6%
MASTER'S DEGREE
79.4/ 100
METRIC RATING
146th/ 347
METRIC RANK
15.4%
MASTER'S DEGREE
73.9/ 100
METRIC RATING
156th/ 347
METRIC RANK
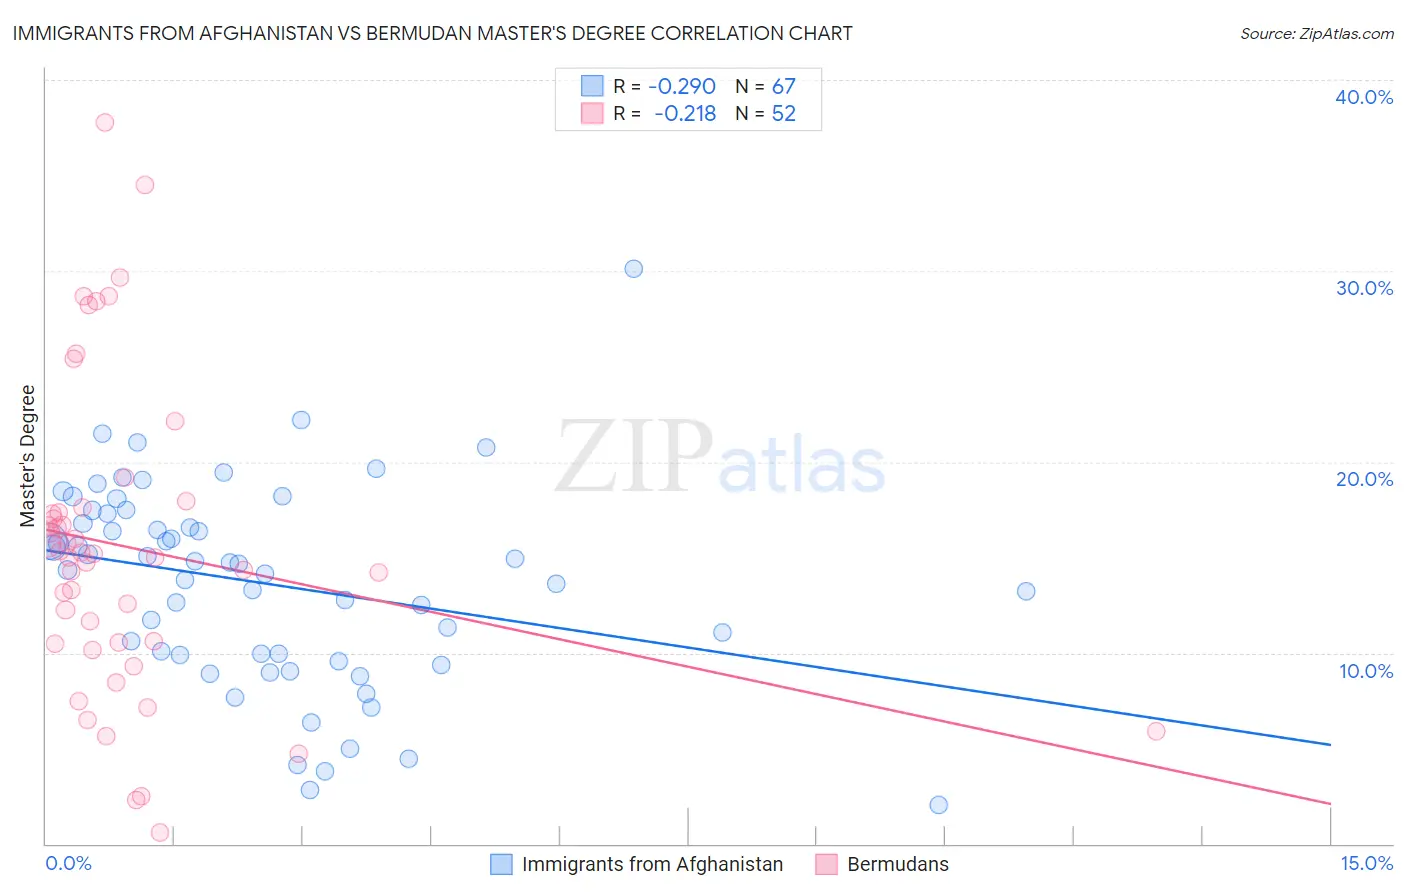
Immigrants from Afghanistan vs Bermudan Master's Degree Correlation Chart
The statistical analysis conducted on geographies consisting of 147,637,931 people shows a weak negative correlation between the proportion of Immigrants from Afghanistan and percentage of population with at least master's degree education in the United States with a correlation coefficient (R) of -0.290 and weighted average of 15.6%. Similarly, the statistical analysis conducted on geographies consisting of 55,727,694 people shows a weak negative correlation between the proportion of Bermudans and percentage of population with at least master's degree education in the United States with a correlation coefficient (R) of -0.218 and weighted average of 15.4%, a difference of 0.94%.
Master's Degree Correlation Summary
| Measurement | Immigrants from Afghanistan | Bermudan |
| Minimum | 2.0% | 0.60% |
| Maximum | 30.1% | 37.8% |
| Range | 28.1% | 37.2% |
| Mean | 13.6% | 15.5% |
| Median | 14.7% | 15.1% |
| Interquartile 25% (IQ1) | 9.9% | 10.5% |
| Interquartile 75% (IQ3) | 17.3% | 17.5% |
| Interquartile Range (IQR) | 7.4% | 7.0% |
| Standard Deviation (Sample) | 5.3% | 8.1% |
| Standard Deviation (Population) | 5.2% | 8.0% |
Demographics Similar to Immigrants from Afghanistan and Bermudans by Master's Degree
In terms of master's degree, the demographic groups most similar to Immigrants from Afghanistan are Hungarian (15.6%, a difference of 0.040%), Immigrants from Senegal (15.5%, a difference of 0.21%), Ghanaian (15.5%, a difference of 0.22%), Slovene (15.5%, a difference of 0.25%), and South American (15.6%, a difference of 0.37%). Similarly, the demographic groups most similar to Bermudans are Immigrants from Cameroon (15.4%, a difference of 0.35%), Immigrants from Bangladesh (15.5%, a difference of 0.36%), Immigrants from Poland (15.4%, a difference of 0.39%), Immigrants from South America (15.5%, a difference of 0.40%), and Luxembourger (15.3%, a difference of 0.45%).
| Demographics | Rating | Rank | Master's Degree |
| Poles | 85.0 /100 | #141 | Excellent 15.7% |
| Immigrants | Africa | 84.0 /100 | #142 | Excellent 15.7% |
| Immigrants | Venezuela | 83.6 /100 | #143 | Excellent 15.7% |
| Canadians | 83.3 /100 | #144 | Excellent 15.7% |
| South Americans | 81.3 /100 | #145 | Excellent 15.6% |
| Immigrants | Afghanistan | 79.4 /100 | #146 | Good 15.6% |
| Hungarians | 79.1 /100 | #147 | Good 15.6% |
| Immigrants | Senegal | 78.2 /100 | #148 | Good 15.5% |
| Ghanaians | 78.2 /100 | #149 | Good 15.5% |
| Slovenes | 78.0 /100 | #150 | Good 15.5% |
| Iraqis | 77.3 /100 | #151 | Good 15.5% |
| Slavs | 77.0 /100 | #152 | Good 15.5% |
| Icelanders | 76.8 /100 | #153 | Good 15.5% |
| Immigrants | South America | 76.3 /100 | #154 | Good 15.5% |
| Immigrants | Bangladesh | 76.1 /100 | #155 | Good 15.5% |
| Bermudans | 73.9 /100 | #156 | Good 15.4% |
| Immigrants | Cameroon | 71.7 /100 | #157 | Good 15.4% |
| Immigrants | Poland | 71.5 /100 | #158 | Good 15.4% |
| Luxembourgers | 71.0 /100 | #159 | Good 15.3% |
| Kenyans | 70.3 /100 | #160 | Good 15.3% |
| Sudanese | 68.7 /100 | #161 | Good 15.3% |