Spaniard vs Bermudan Single Father Poverty
COMPARE
Spaniard
Bermudan
Single Father Poverty
Single Father Poverty Comparison
Spaniards
Bermudans
17.2%
SINGLE FATHER POVERTY
0.6/ 100
METRIC RATING
260th/ 347
METRIC RANK
16.9%
SINGLE FATHER POVERTY
2.6/ 100
METRIC RATING
239th/ 347
METRIC RANK
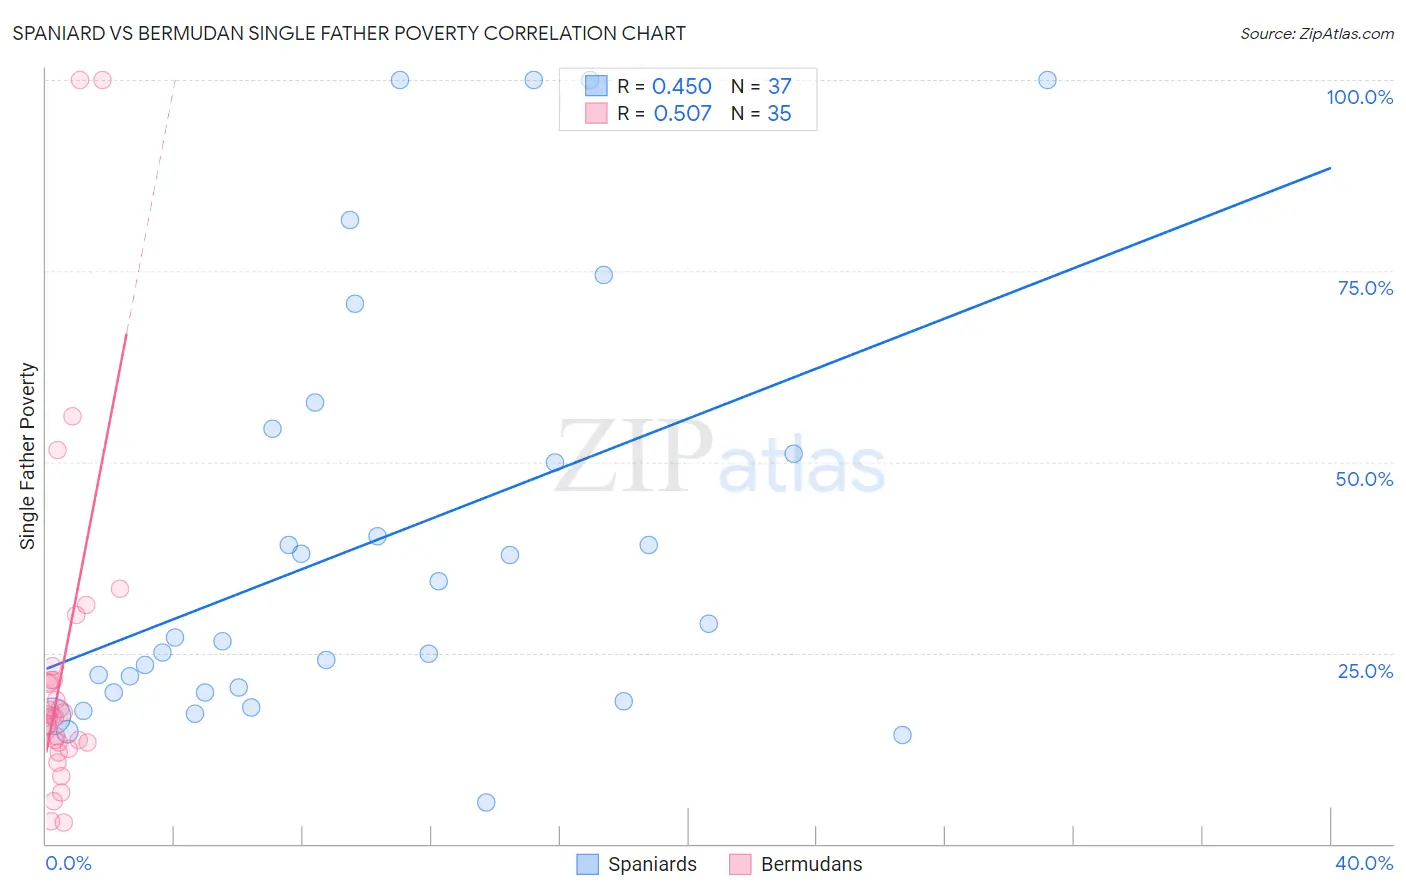
Spaniard vs Bermudan Single Father Poverty Correlation Chart
The statistical analysis conducted on geographies consisting of 345,009,065 people shows a moderate positive correlation between the proportion of Spaniards and poverty level among single fathers in the United States with a correlation coefficient (R) of 0.450 and weighted average of 17.2%. Similarly, the statistical analysis conducted on geographies consisting of 52,766,587 people shows a substantial positive correlation between the proportion of Bermudans and poverty level among single fathers in the United States with a correlation coefficient (R) of 0.507 and weighted average of 16.9%, a difference of 1.6%.
Single Father Poverty Correlation Summary
| Measurement | Spaniard | Bermudan |
| Minimum | 5.4% | 2.7% |
| Maximum | 100.0% | 100.0% |
| Range | 94.6% | 97.3% |
| Mean | 39.8% | 23.1% |
| Median | 27.0% | 16.7% |
| Interquartile 25% (IQ1) | 19.8% | 13.2% |
| Interquartile 75% (IQ3) | 52.7% | 21.5% |
| Interquartile Range (IQR) | 32.9% | 8.2% |
| Standard Deviation (Sample) | 27.6% | 22.2% |
| Standard Deviation (Population) | 27.2% | 21.9% |
Similar Demographics by Single Father Poverty
Demographics Similar to Spaniards by Single Father Poverty
In terms of single father poverty, the demographic groups most similar to Spaniards are Immigrants from Jamaica (17.2%, a difference of 0.15%), Albanian (17.2%, a difference of 0.18%), Immigrants from Albania (17.2%, a difference of 0.20%), Swiss (17.3%, a difference of 0.22%), and Immigrants from Haiti (17.2%, a difference of 0.28%).
| Demographics | Rating | Rank | Single Father Poverty |
| Cree | 1.0 /100 | #253 | Tragic 17.1% |
| Immigrants | Honduras | 0.9 /100 | #254 | Tragic 17.1% |
| Sierra Leoneans | 0.8 /100 | #255 | Tragic 17.2% |
| Immigrants | Haiti | 0.8 /100 | #256 | Tragic 17.2% |
| Immigrants | Albania | 0.7 /100 | #257 | Tragic 17.2% |
| Albanians | 0.7 /100 | #258 | Tragic 17.2% |
| Immigrants | Jamaica | 0.7 /100 | #259 | Tragic 17.2% |
| Spaniards | 0.6 /100 | #260 | Tragic 17.2% |
| Swiss | 0.5 /100 | #261 | Tragic 17.3% |
| Immigrants | Zaire | 0.4 /100 | #262 | Tragic 17.3% |
| Lithuanians | 0.4 /100 | #263 | Tragic 17.3% |
| Slovenes | 0.3 /100 | #264 | Tragic 17.3% |
| Poles | 0.3 /100 | #265 | Tragic 17.3% |
| Jamaicans | 0.3 /100 | #266 | Tragic 17.3% |
| Haitians | 0.3 /100 | #267 | Tragic 17.3% |
Demographics Similar to Bermudans by Single Father Poverty
In terms of single father poverty, the demographic groups most similar to Bermudans are Finnish (16.9%, a difference of 0.010%), Immigrants from Saudi Arabia (16.9%, a difference of 0.020%), Immigrants from Western Europe (16.9%, a difference of 0.090%), Immigrants from Germany (16.9%, a difference of 0.090%), and Subsaharan African (16.9%, a difference of 0.090%).
| Demographics | Rating | Rank | Single Father Poverty |
| Immigrants | Grenada | 3.7 /100 | #232 | Tragic 16.9% |
| Senegalese | 3.2 /100 | #233 | Tragic 16.9% |
| Marshallese | 3.1 /100 | #234 | Tragic 16.9% |
| Immigrants | Western Europe | 2.9 /100 | #235 | Tragic 16.9% |
| Immigrants | Germany | 2.9 /100 | #236 | Tragic 16.9% |
| Sub-Saharan Africans | 2.9 /100 | #237 | Tragic 16.9% |
| Immigrants | Saudi Arabia | 2.7 /100 | #238 | Tragic 16.9% |
| Bermudans | 2.6 /100 | #239 | Tragic 16.9% |
| Finns | 2.6 /100 | #240 | Tragic 16.9% |
| Czechs | 2.3 /100 | #241 | Tragic 17.0% |
| Moroccans | 2.1 /100 | #242 | Tragic 17.0% |
| Immigrants | Cabo Verde | 1.6 /100 | #243 | Tragic 17.0% |
| Hondurans | 1.6 /100 | #244 | Tragic 17.0% |
| Trinidadians and Tobagonians | 1.5 /100 | #245 | Tragic 17.0% |
| Immigrants | Ireland | 1.4 /100 | #246 | Tragic 17.1% |