South African vs Immigrants from Syria College, 1 year or more
COMPARE
South African
Immigrants from Syria
College, 1 year or more
College, 1 year or more Comparison
South Africans
Immigrants from Syria
64.1%
COLLEGE, 1 YEAR OR MORE
99.7/ 100
METRIC RATING
57th/ 347
METRIC RANK
61.3%
COLLEGE, 1 YEAR OR MORE
91.6/ 100
METRIC RATING
125th/ 347
METRIC RANK
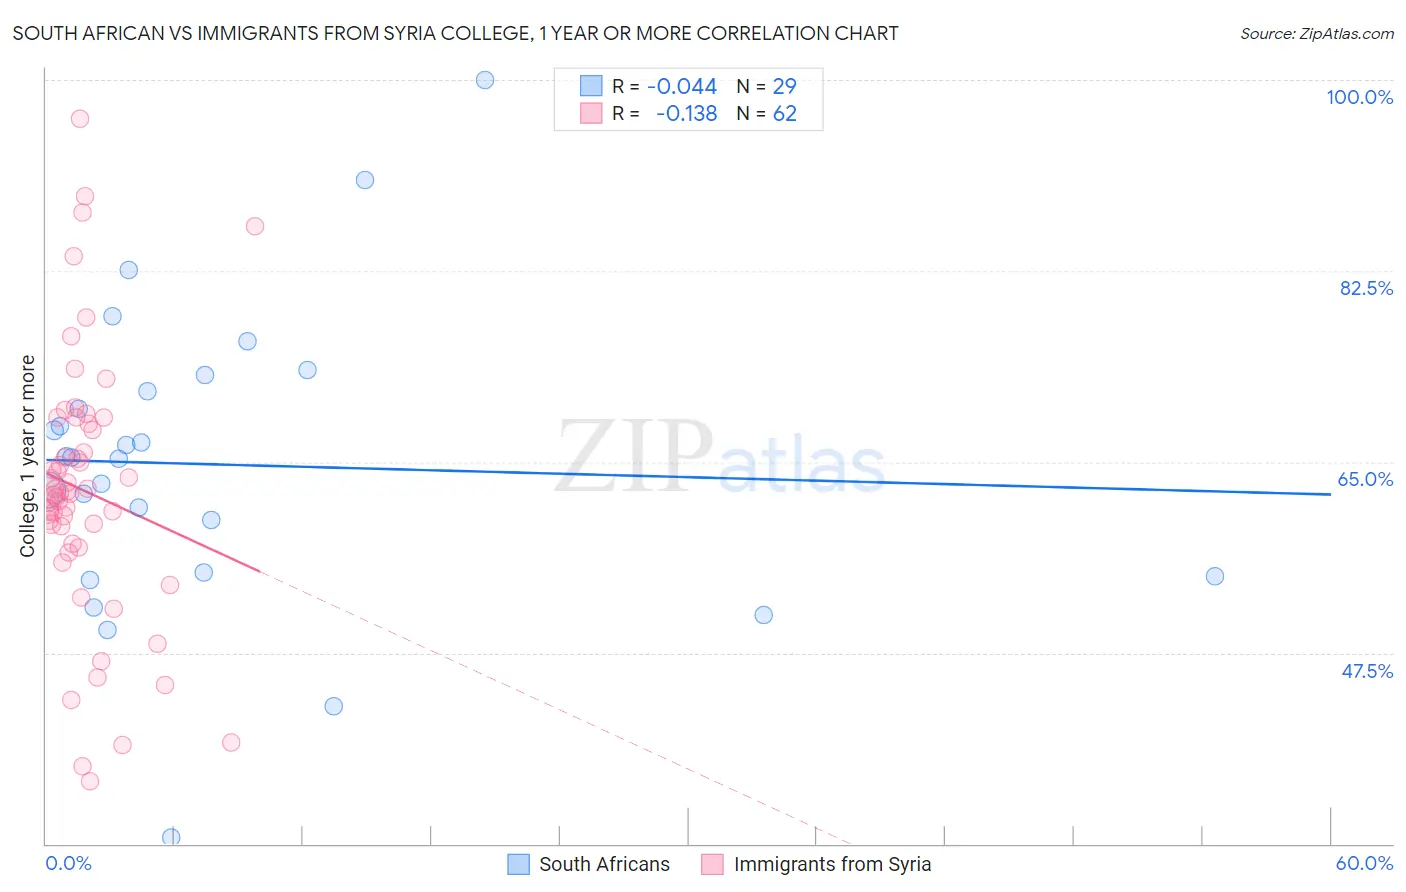
South African vs Immigrants from Syria College, 1 year or more Correlation Chart
The statistical analysis conducted on geographies consisting of 182,603,987 people shows no correlation between the proportion of South Africans and percentage of population with at least college, 1 year or more education in the United States with a correlation coefficient (R) of -0.044 and weighted average of 64.1%. Similarly, the statistical analysis conducted on geographies consisting of 174,109,130 people shows a poor negative correlation between the proportion of Immigrants from Syria and percentage of population with at least college, 1 year or more education in the United States with a correlation coefficient (R) of -0.138 and weighted average of 61.3%, a difference of 4.5%.
College, 1 year or more Correlation Summary
| Measurement | South African | Immigrants from Syria |
| Minimum | 30.6% | 35.7% |
| Maximum | 100.0% | 96.4% |
| Range | 69.4% | 60.7% |
| Mean | 64.8% | 62.3% |
| Median | 65.4% | 62.1% |
| Interquartile 25% (IQ1) | 54.7% | 57.5% |
| Interquartile 75% (IQ3) | 72.3% | 68.5% |
| Interquartile Range (IQR) | 17.6% | 11.0% |
| Standard Deviation (Sample) | 13.9% | 12.2% |
| Standard Deviation (Population) | 13.7% | 12.1% |
Similar Demographics by College, 1 year or more
Demographics Similar to South Africans by College, 1 year or more
In terms of college, 1 year or more, the demographic groups most similar to South Africans are Immigrants from Czechoslovakia (64.1%, a difference of 0.010%), Immigrants from Belarus (64.1%, a difference of 0.040%), Immigrants from Asia (64.0%, a difference of 0.14%), Zimbabwean (64.2%, a difference of 0.16%), and Asian (64.2%, a difference of 0.19%).
| Demographics | Rating | Rank | College, 1 year or more |
| Immigrants | Austria | 99.8 /100 | #50 | Exceptional 64.4% |
| Immigrants | Malaysia | 99.8 /100 | #51 | Exceptional 64.3% |
| Immigrants | Netherlands | 99.8 /100 | #52 | Exceptional 64.2% |
| Asians | 99.8 /100 | #53 | Exceptional 64.2% |
| Zimbabweans | 99.8 /100 | #54 | Exceptional 64.2% |
| Immigrants | Belarus | 99.7 /100 | #55 | Exceptional 64.1% |
| Immigrants | Czechoslovakia | 99.7 /100 | #56 | Exceptional 64.1% |
| South Africans | 99.7 /100 | #57 | Exceptional 64.1% |
| Immigrants | Asia | 99.7 /100 | #58 | Exceptional 64.0% |
| Immigrants | Serbia | 99.6 /100 | #59 | Exceptional 63.8% |
| Immigrants | Kazakhstan | 99.5 /100 | #60 | Exceptional 63.6% |
| Bolivians | 99.5 /100 | #61 | Exceptional 63.5% |
| Immigrants | Indonesia | 99.5 /100 | #62 | Exceptional 63.5% |
| Immigrants | Scotland | 99.4 /100 | #63 | Exceptional 63.4% |
| Immigrants | Spain | 99.4 /100 | #64 | Exceptional 63.4% |
Demographics Similar to Immigrants from Syria by College, 1 year or more
In terms of college, 1 year or more, the demographic groups most similar to Immigrants from Syria are Alsatian (61.3%, a difference of 0.050%), Immigrants from Eastern Africa (61.2%, a difference of 0.070%), Venezuelan (61.3%, a difference of 0.080%), Immigrants from Italy (61.2%, a difference of 0.080%), and Serbian (61.4%, a difference of 0.11%).
| Demographics | Rating | Rank | College, 1 year or more |
| Immigrants | Brazil | 93.9 /100 | #118 | Exceptional 61.6% |
| Assyrians/Chaldeans/Syriacs | 93.3 /100 | #119 | Exceptional 61.5% |
| Pakistanis | 93.2 /100 | #120 | Exceptional 61.5% |
| Immigrants | Jordan | 92.7 /100 | #121 | Exceptional 61.4% |
| Immigrants | Chile | 92.3 /100 | #122 | Exceptional 61.4% |
| Serbians | 92.2 /100 | #123 | Exceptional 61.4% |
| Venezuelans | 92.1 /100 | #124 | Exceptional 61.3% |
| Immigrants | Syria | 91.6 /100 | #125 | Exceptional 61.3% |
| Alsatians | 91.3 /100 | #126 | Exceptional 61.3% |
| Immigrants | Eastern Africa | 91.1 /100 | #127 | Exceptional 61.2% |
| Immigrants | Italy | 91.1 /100 | #128 | Exceptional 61.2% |
| Ugandans | 90.7 /100 | #129 | Exceptional 61.2% |
| Italians | 89.5 /100 | #130 | Excellent 61.1% |
| Immigrants | Morocco | 89.5 /100 | #131 | Excellent 61.1% |
| Scandinavians | 88.2 /100 | #132 | Excellent 61.0% |