Panamanian vs Immigrants from Syria College, 1 year or more
COMPARE
Panamanian
Immigrants from Syria
College, 1 year or more
College, 1 year or more Comparison
Panamanians
Immigrants from Syria
58.3%
COLLEGE, 1 YEAR OR MORE
19.2/ 100
METRIC RATING
204th/ 347
METRIC RANK
61.3%
COLLEGE, 1 YEAR OR MORE
91.6/ 100
METRIC RATING
125th/ 347
METRIC RANK
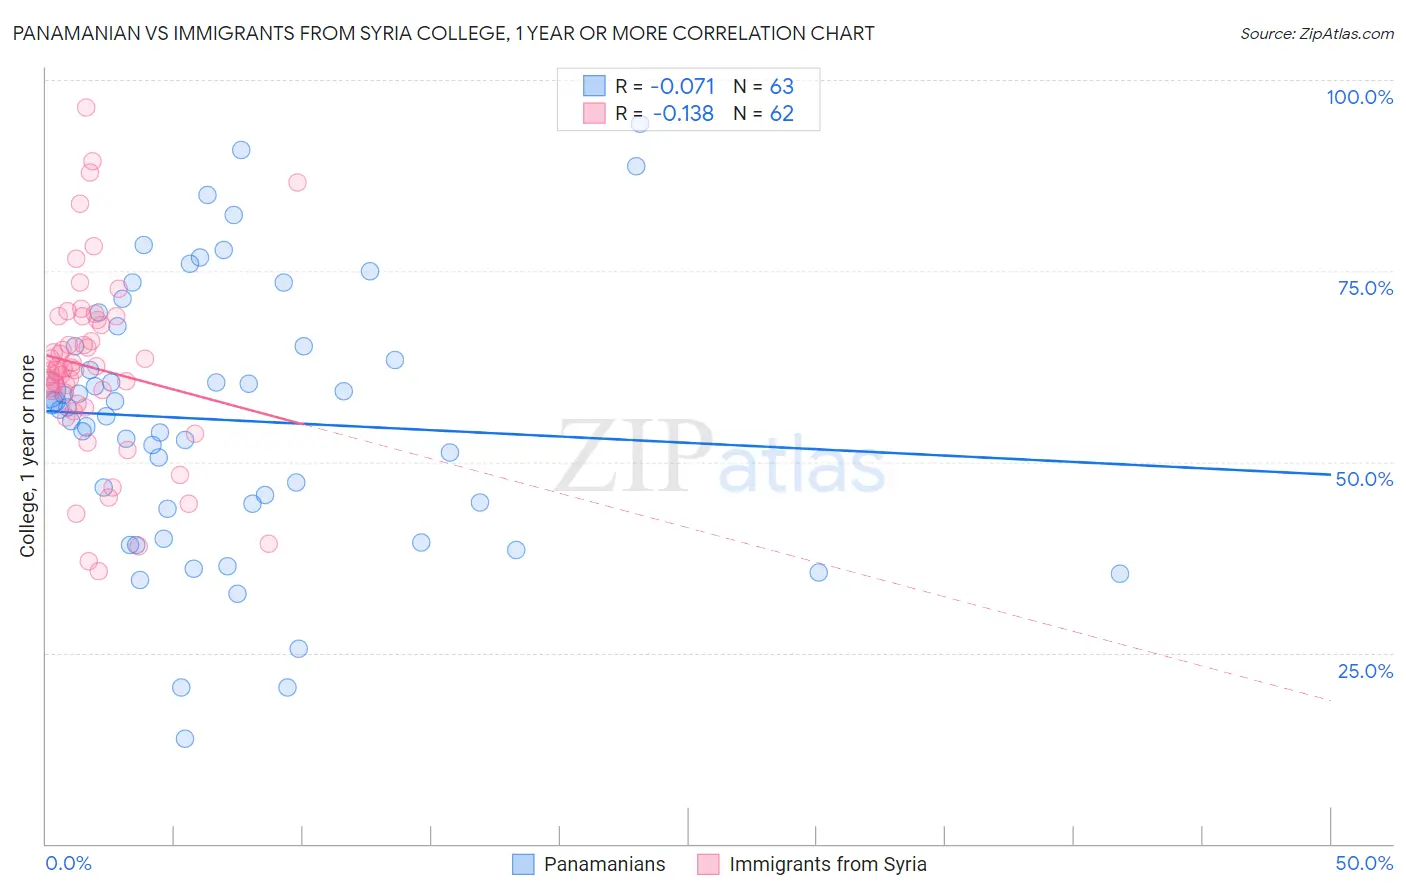
Panamanian vs Immigrants from Syria College, 1 year or more Correlation Chart
The statistical analysis conducted on geographies consisting of 281,250,786 people shows a slight negative correlation between the proportion of Panamanians and percentage of population with at least college, 1 year or more education in the United States with a correlation coefficient (R) of -0.071 and weighted average of 58.3%. Similarly, the statistical analysis conducted on geographies consisting of 174,109,130 people shows a poor negative correlation between the proportion of Immigrants from Syria and percentage of population with at least college, 1 year or more education in the United States with a correlation coefficient (R) of -0.138 and weighted average of 61.3%, a difference of 5.2%.
College, 1 year or more Correlation Summary
| Measurement | Panamanian | Immigrants from Syria |
| Minimum | 13.8% | 35.7% |
| Maximum | 94.2% | 96.4% |
| Range | 80.4% | 60.7% |
| Mean | 55.5% | 62.3% |
| Median | 56.8% | 62.1% |
| Interquartile 25% (IQ1) | 43.9% | 57.5% |
| Interquartile 75% (IQ3) | 65.2% | 68.5% |
| Interquartile Range (IQR) | 21.3% | 11.0% |
| Standard Deviation (Sample) | 17.5% | 12.2% |
| Standard Deviation (Population) | 17.4% | 12.1% |
Similar Demographics by College, 1 year or more
Demographics Similar to Panamanians by College, 1 year or more
In terms of college, 1 year or more, the demographic groups most similar to Panamanians are Immigrants from Zaire (58.3%, a difference of 0.050%), Immigrants from Vietnam (58.2%, a difference of 0.090%), Ghanaian (58.4%, a difference of 0.14%), Senegalese (58.2%, a difference of 0.21%), and Immigrants from South America (58.4%, a difference of 0.23%).
| Demographics | Rating | Rank | College, 1 year or more |
| Immigrants | Thailand | 26.0 /100 | #197 | Fair 58.6% |
| Immigrants | South Eastern Asia | 25.1 /100 | #198 | Fair 58.5% |
| Slovaks | 24.6 /100 | #199 | Fair 58.5% |
| Spanish | 24.2 /100 | #200 | Fair 58.5% |
| Nigerians | 23.0 /100 | #201 | Fair 58.5% |
| Immigrants | South America | 21.9 /100 | #202 | Fair 58.4% |
| Ghanaians | 20.9 /100 | #203 | Fair 58.4% |
| Panamanians | 19.2 /100 | #204 | Poor 58.3% |
| Immigrants | Zaire | 18.7 /100 | #205 | Poor 58.3% |
| Immigrants | Vietnam | 18.2 /100 | #206 | Poor 58.2% |
| Senegalese | 16.9 /100 | #207 | Poor 58.2% |
| Immigrants | Uruguay | 15.2 /100 | #208 | Poor 58.1% |
| Immigrants | Middle Africa | 14.0 /100 | #209 | Poor 58.0% |
| Tsimshian | 13.5 /100 | #210 | Poor 57.9% |
| Immigrants | Nigeria | 13.3 /100 | #211 | Poor 57.9% |
Demographics Similar to Immigrants from Syria by College, 1 year or more
In terms of college, 1 year or more, the demographic groups most similar to Immigrants from Syria are Alsatian (61.3%, a difference of 0.050%), Immigrants from Eastern Africa (61.2%, a difference of 0.070%), Venezuelan (61.3%, a difference of 0.080%), Immigrants from Italy (61.2%, a difference of 0.080%), and Serbian (61.4%, a difference of 0.11%).
| Demographics | Rating | Rank | College, 1 year or more |
| Immigrants | Brazil | 93.9 /100 | #118 | Exceptional 61.6% |
| Assyrians/Chaldeans/Syriacs | 93.3 /100 | #119 | Exceptional 61.5% |
| Pakistanis | 93.2 /100 | #120 | Exceptional 61.5% |
| Immigrants | Jordan | 92.7 /100 | #121 | Exceptional 61.4% |
| Immigrants | Chile | 92.3 /100 | #122 | Exceptional 61.4% |
| Serbians | 92.2 /100 | #123 | Exceptional 61.4% |
| Venezuelans | 92.1 /100 | #124 | Exceptional 61.3% |
| Immigrants | Syria | 91.6 /100 | #125 | Exceptional 61.3% |
| Alsatians | 91.3 /100 | #126 | Exceptional 61.3% |
| Immigrants | Eastern Africa | 91.1 /100 | #127 | Exceptional 61.2% |
| Immigrants | Italy | 91.1 /100 | #128 | Exceptional 61.2% |
| Ugandans | 90.7 /100 | #129 | Exceptional 61.2% |
| Italians | 89.5 /100 | #130 | Excellent 61.1% |
| Immigrants | Morocco | 89.5 /100 | #131 | Excellent 61.1% |
| Scandinavians | 88.2 /100 | #132 | Excellent 61.0% |