Immigrants from Eritrea vs Immigrants from Syria College, 1 year or more
COMPARE
Immigrants from Eritrea
Immigrants from Syria
College, 1 year or more
College, 1 year or more Comparison
Immigrants from Eritrea
Immigrants from Syria
60.7%
COLLEGE, 1 YEAR OR MORE
84.3/ 100
METRIC RATING
139th/ 347
METRIC RANK
61.3%
COLLEGE, 1 YEAR OR MORE
91.6/ 100
METRIC RATING
125th/ 347
METRIC RANK
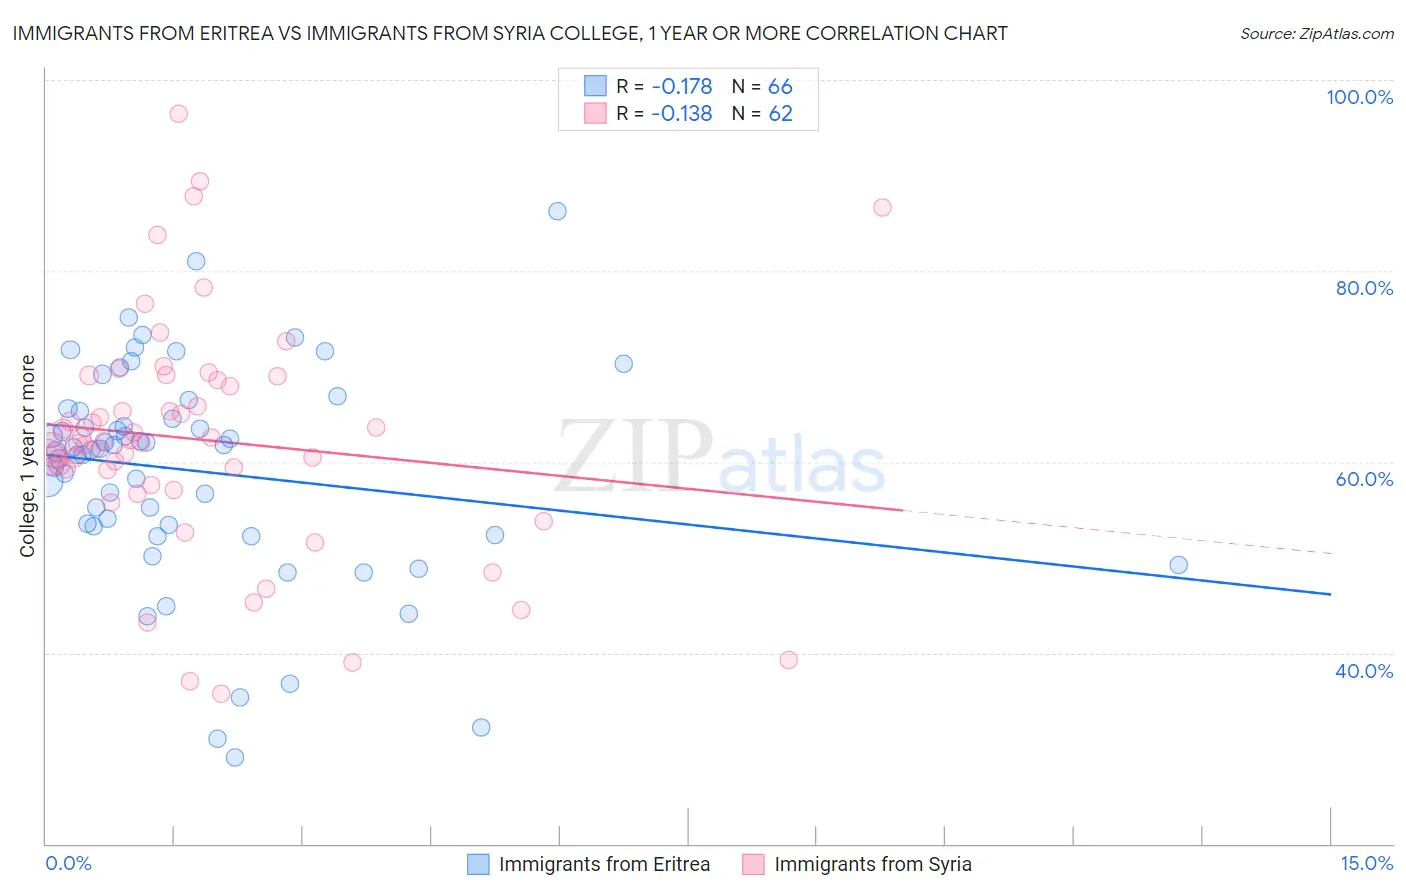
Immigrants from Eritrea vs Immigrants from Syria College, 1 year or more Correlation Chart
The statistical analysis conducted on geographies consisting of 104,852,788 people shows a poor negative correlation between the proportion of Immigrants from Eritrea and percentage of population with at least college, 1 year or more education in the United States with a correlation coefficient (R) of -0.178 and weighted average of 60.7%. Similarly, the statistical analysis conducted on geographies consisting of 174,109,130 people shows a poor negative correlation between the proportion of Immigrants from Syria and percentage of population with at least college, 1 year or more education in the United States with a correlation coefficient (R) of -0.138 and weighted average of 61.3%, a difference of 0.92%.
College, 1 year or more Correlation Summary
| Measurement | Immigrants from Eritrea | Immigrants from Syria |
| Minimum | 29.1% | 35.7% |
| Maximum | 86.2% | 96.4% |
| Range | 57.1% | 60.7% |
| Mean | 59.0% | 62.3% |
| Median | 61.3% | 62.1% |
| Interquartile 25% (IQ1) | 53.3% | 57.5% |
| Interquartile 75% (IQ3) | 65.3% | 68.5% |
| Interquartile Range (IQR) | 12.0% | 11.0% |
| Standard Deviation (Sample) | 11.3% | 12.2% |
| Standard Deviation (Population) | 11.3% | 12.1% |
Demographics Similar to Immigrants from Eritrea and Immigrants from Syria by College, 1 year or more
In terms of college, 1 year or more, the demographic groups most similar to Immigrants from Eritrea are Taiwanese (60.7%, a difference of 0.0%), Iraqi (60.7%, a difference of 0.090%), Immigrants from Afghanistan (60.7%, a difference of 0.11%), Polish (60.7%, a difference of 0.14%), and Slovene (60.9%, a difference of 0.22%). Similarly, the demographic groups most similar to Immigrants from Syria are Alsatian (61.3%, a difference of 0.050%), Immigrants from Eastern Africa (61.2%, a difference of 0.070%), Venezuelan (61.3%, a difference of 0.080%), Immigrants from Italy (61.2%, a difference of 0.080%), and Serbian (61.4%, a difference of 0.11%).
| Demographics | Rating | Rank | College, 1 year or more |
| Immigrants | Chile | 92.3 /100 | #122 | Exceptional 61.4% |
| Serbians | 92.2 /100 | #123 | Exceptional 61.4% |
| Venezuelans | 92.1 /100 | #124 | Exceptional 61.3% |
| Immigrants | Syria | 91.6 /100 | #125 | Exceptional 61.3% |
| Alsatians | 91.3 /100 | #126 | Exceptional 61.3% |
| Immigrants | Eastern Africa | 91.1 /100 | #127 | Exceptional 61.2% |
| Immigrants | Italy | 91.1 /100 | #128 | Exceptional 61.2% |
| Ugandans | 90.7 /100 | #129 | Exceptional 61.2% |
| Italians | 89.5 /100 | #130 | Excellent 61.1% |
| Immigrants | Morocco | 89.5 /100 | #131 | Excellent 61.1% |
| Scandinavians | 88.2 /100 | #132 | Excellent 61.0% |
| Immigrants | Uzbekistan | 88.0 /100 | #133 | Excellent 61.0% |
| Immigrants | Venezuela | 87.9 /100 | #134 | Excellent 61.0% |
| Immigrants | Uganda | 87.4 /100 | #135 | Excellent 60.9% |
| Basques | 87.2 /100 | #136 | Excellent 60.9% |
| Slovenes | 86.5 /100 | #137 | Excellent 60.9% |
| Taiwanese | 84.3 /100 | #138 | Excellent 60.7% |
| Immigrants | Eritrea | 84.3 /100 | #139 | Excellent 60.7% |
| Iraqis | 83.3 /100 | #140 | Excellent 60.7% |
| Immigrants | Afghanistan | 83.1 /100 | #141 | Excellent 60.7% |
| Poles | 82.8 /100 | #142 | Excellent 60.7% |