Immigrants from Israel vs Immigrants from Syria College, 1 year or more
COMPARE
Immigrants from Israel
Immigrants from Syria
College, 1 year or more
College, 1 year or more Comparison
Immigrants from Israel
Immigrants from Syria
67.8%
COLLEGE, 1 YEAR OR MORE
100.0/ 100
METRIC RATING
9th/ 347
METRIC RANK
61.3%
COLLEGE, 1 YEAR OR MORE
91.6/ 100
METRIC RATING
125th/ 347
METRIC RANK
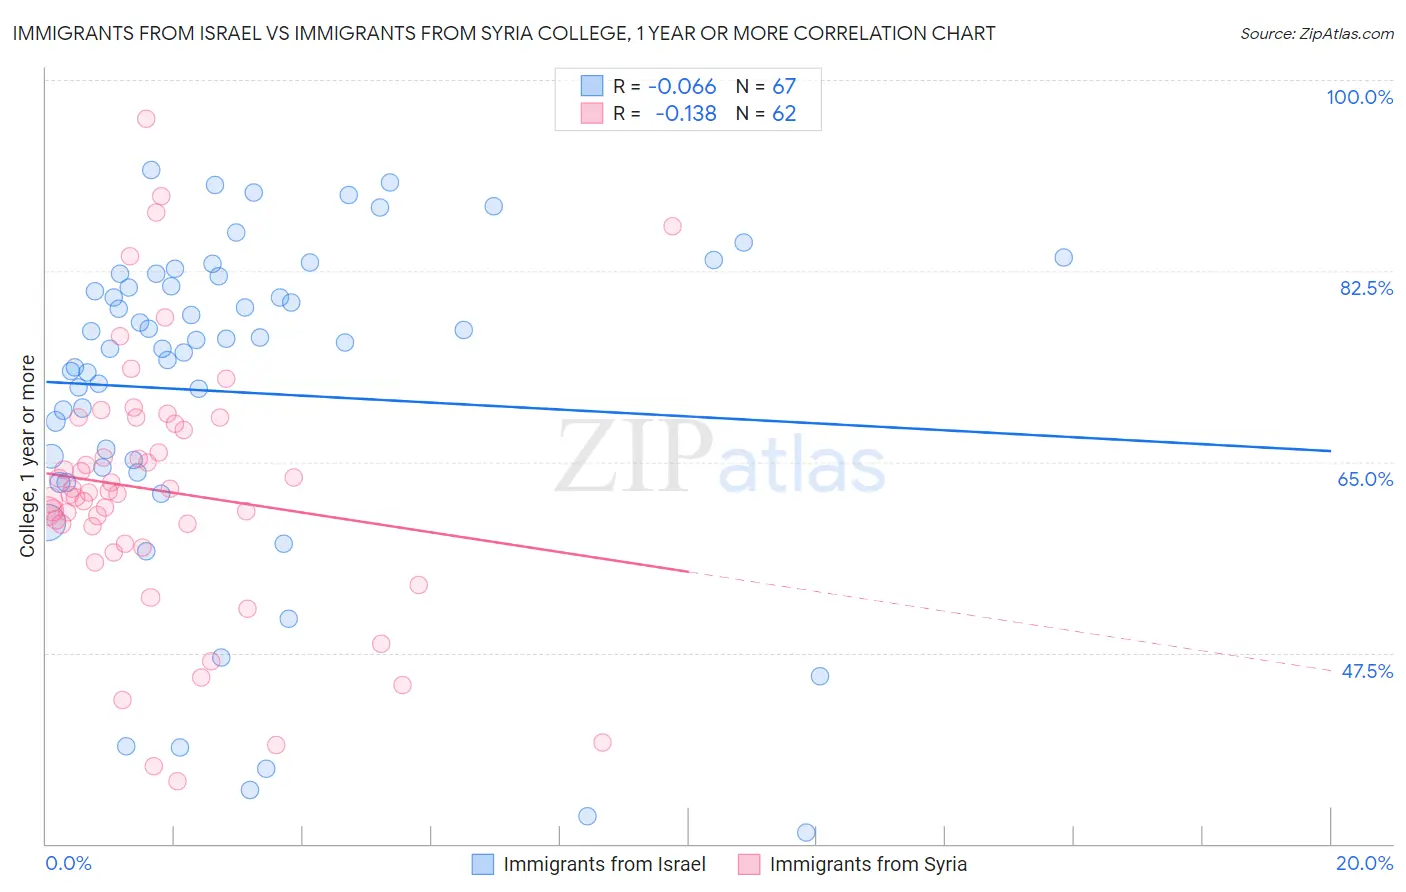
Immigrants from Israel vs Immigrants from Syria College, 1 year or more Correlation Chart
The statistical analysis conducted on geographies consisting of 210,030,735 people shows a slight negative correlation between the proportion of Immigrants from Israel and percentage of population with at least college, 1 year or more education in the United States with a correlation coefficient (R) of -0.066 and weighted average of 67.8%. Similarly, the statistical analysis conducted on geographies consisting of 174,109,130 people shows a poor negative correlation between the proportion of Immigrants from Syria and percentage of population with at least college, 1 year or more education in the United States with a correlation coefficient (R) of -0.138 and weighted average of 61.3%, a difference of 10.6%.
College, 1 year or more Correlation Summary
| Measurement | Immigrants from Israel | Immigrants from Syria |
| Minimum | 31.0% | 35.7% |
| Maximum | 91.7% | 96.4% |
| Range | 60.7% | 60.7% |
| Mean | 71.4% | 62.3% |
| Median | 75.9% | 62.1% |
| Interquartile 25% (IQ1) | 64.4% | 57.5% |
| Interquartile 75% (IQ3) | 82.0% | 68.5% |
| Interquartile Range (IQR) | 17.6% | 11.0% |
| Standard Deviation (Sample) | 15.2% | 12.2% |
| Standard Deviation (Population) | 15.1% | 12.1% |
Similar Demographics by College, 1 year or more
Demographics Similar to Immigrants from Israel by College, 1 year or more
In terms of college, 1 year or more, the demographic groups most similar to Immigrants from Israel are Immigrants from Australia (67.7%, a difference of 0.22%), Immigrants from South Central Asia (67.1%, a difference of 0.99%), Thai (68.6%, a difference of 1.2%), Cypriot (67.0%, a difference of 1.2%), and Immigrants from Sweden (66.8%, a difference of 1.5%).
| Demographics | Rating | Rank | College, 1 year or more |
| Immigrants | Singapore | 100.0 /100 | #2 | Exceptional 70.1% |
| Iranians | 100.0 /100 | #3 | Exceptional 70.0% |
| Immigrants | Taiwan | 100.0 /100 | #4 | Exceptional 69.6% |
| Immigrants | India | 100.0 /100 | #5 | Exceptional 69.6% |
| Immigrants | Iran | 100.0 /100 | #6 | Exceptional 69.5% |
| Okinawans | 100.0 /100 | #7 | Exceptional 69.0% |
| Thais | 100.0 /100 | #8 | Exceptional 68.6% |
| Immigrants | Israel | 100.0 /100 | #9 | Exceptional 67.8% |
| Immigrants | Australia | 100.0 /100 | #10 | Exceptional 67.7% |
| Immigrants | South Central Asia | 100.0 /100 | #11 | Exceptional 67.1% |
| Cypriots | 100.0 /100 | #12 | Exceptional 67.0% |
| Immigrants | Sweden | 100.0 /100 | #13 | Exceptional 66.8% |
| Burmese | 100.0 /100 | #14 | Exceptional 66.7% |
| Cambodians | 100.0 /100 | #15 | Exceptional 66.7% |
| Immigrants | Japan | 100.0 /100 | #16 | Exceptional 66.7% |
Demographics Similar to Immigrants from Syria by College, 1 year or more
In terms of college, 1 year or more, the demographic groups most similar to Immigrants from Syria are Alsatian (61.3%, a difference of 0.050%), Immigrants from Eastern Africa (61.2%, a difference of 0.070%), Venezuelan (61.3%, a difference of 0.080%), Immigrants from Italy (61.2%, a difference of 0.080%), and Serbian (61.4%, a difference of 0.11%).
| Demographics | Rating | Rank | College, 1 year or more |
| Immigrants | Brazil | 93.9 /100 | #118 | Exceptional 61.6% |
| Assyrians/Chaldeans/Syriacs | 93.3 /100 | #119 | Exceptional 61.5% |
| Pakistanis | 93.2 /100 | #120 | Exceptional 61.5% |
| Immigrants | Jordan | 92.7 /100 | #121 | Exceptional 61.4% |
| Immigrants | Chile | 92.3 /100 | #122 | Exceptional 61.4% |
| Serbians | 92.2 /100 | #123 | Exceptional 61.4% |
| Venezuelans | 92.1 /100 | #124 | Exceptional 61.3% |
| Immigrants | Syria | 91.6 /100 | #125 | Exceptional 61.3% |
| Alsatians | 91.3 /100 | #126 | Exceptional 61.3% |
| Immigrants | Eastern Africa | 91.1 /100 | #127 | Exceptional 61.2% |
| Immigrants | Italy | 91.1 /100 | #128 | Exceptional 61.2% |
| Ugandans | 90.7 /100 | #129 | Exceptional 61.2% |
| Italians | 89.5 /100 | #130 | Excellent 61.1% |
| Immigrants | Morocco | 89.5 /100 | #131 | Excellent 61.1% |
| Scandinavians | 88.2 /100 | #132 | Excellent 61.0% |