South African vs Immigrants from Belarus College, 1 year or more
COMPARE
South African
Immigrants from Belarus
College, 1 year or more
College, 1 year or more Comparison
South Africans
Immigrants from Belarus
64.1%
COLLEGE, 1 YEAR OR MORE
99.7/ 100
METRIC RATING
57th/ 347
METRIC RANK
64.1%
COLLEGE, 1 YEAR OR MORE
99.7/ 100
METRIC RATING
55th/ 347
METRIC RANK
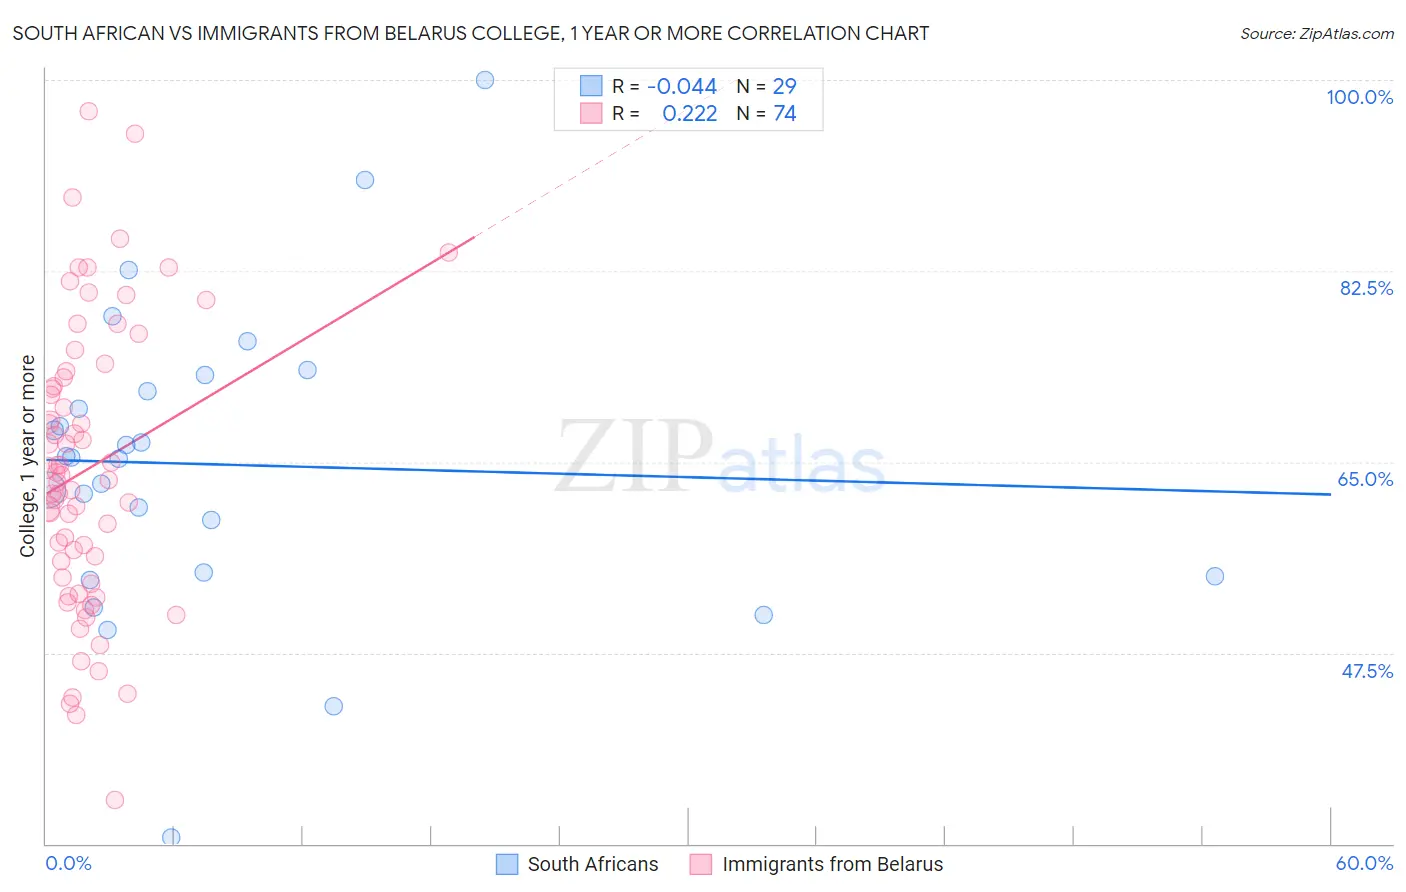
South African vs Immigrants from Belarus College, 1 year or more Correlation Chart
The statistical analysis conducted on geographies consisting of 182,603,987 people shows no correlation between the proportion of South Africans and percentage of population with at least college, 1 year or more education in the United States with a correlation coefficient (R) of -0.044 and weighted average of 64.1%. Similarly, the statistical analysis conducted on geographies consisting of 150,205,158 people shows a weak positive correlation between the proportion of Immigrants from Belarus and percentage of population with at least college, 1 year or more education in the United States with a correlation coefficient (R) of 0.222 and weighted average of 64.1%, a difference of 0.040%.
College, 1 year or more Correlation Summary
| Measurement | South African | Immigrants from Belarus |
| Minimum | 30.6% | 34.0% |
| Maximum | 100.0% | 97.2% |
| Range | 69.4% | 63.1% |
| Mean | 64.8% | 64.3% |
| Median | 65.4% | 63.6% |
| Interquartile 25% (IQ1) | 54.7% | 54.4% |
| Interquartile 75% (IQ3) | 72.3% | 72.8% |
| Interquartile Range (IQR) | 17.6% | 18.4% |
| Standard Deviation (Sample) | 13.9% | 13.1% |
| Standard Deviation (Population) | 13.7% | 13.0% |
Demographics Similar to South Africans and Immigrants from Belarus by College, 1 year or more
In terms of college, 1 year or more, the demographic groups most similar to South Africans are Immigrants from Czechoslovakia (64.1%, a difference of 0.010%), Immigrants from Asia (64.0%, a difference of 0.14%), Zimbabwean (64.2%, a difference of 0.16%), Asian (64.2%, a difference of 0.19%), and Immigrants from Netherlands (64.2%, a difference of 0.21%). Similarly, the demographic groups most similar to Immigrants from Belarus are Immigrants from Czechoslovakia (64.1%, a difference of 0.030%), Zimbabwean (64.2%, a difference of 0.12%), Asian (64.2%, a difference of 0.15%), Immigrants from Netherlands (64.2%, a difference of 0.17%), and Immigrants from Asia (64.0%, a difference of 0.18%).
| Demographics | Rating | Rank | College, 1 year or more |
| Bhutanese | 99.9 /100 | #46 | Exceptional 64.6% |
| Australians | 99.9 /100 | #47 | Exceptional 64.6% |
| Immigrants | Bulgaria | 99.9 /100 | #48 | Exceptional 64.6% |
| New Zealanders | 99.9 /100 | #49 | Exceptional 64.6% |
| Immigrants | Austria | 99.8 /100 | #50 | Exceptional 64.4% |
| Immigrants | Malaysia | 99.8 /100 | #51 | Exceptional 64.3% |
| Immigrants | Netherlands | 99.8 /100 | #52 | Exceptional 64.2% |
| Asians | 99.8 /100 | #53 | Exceptional 64.2% |
| Zimbabweans | 99.8 /100 | #54 | Exceptional 64.2% |
| Immigrants | Belarus | 99.7 /100 | #55 | Exceptional 64.1% |
| Immigrants | Czechoslovakia | 99.7 /100 | #56 | Exceptional 64.1% |
| South Africans | 99.7 /100 | #57 | Exceptional 64.1% |
| Immigrants | Asia | 99.7 /100 | #58 | Exceptional 64.0% |
| Immigrants | Serbia | 99.6 /100 | #59 | Exceptional 63.8% |
| Immigrants | Kazakhstan | 99.5 /100 | #60 | Exceptional 63.6% |
| Bolivians | 99.5 /100 | #61 | Exceptional 63.5% |
| Immigrants | Indonesia | 99.5 /100 | #62 | Exceptional 63.5% |
| Immigrants | Scotland | 99.4 /100 | #63 | Exceptional 63.4% |
| Immigrants | Spain | 99.4 /100 | #64 | Exceptional 63.4% |
| Maltese | 99.3 /100 | #65 | Exceptional 63.4% |
| Immigrants | Europe | 99.3 /100 | #66 | Exceptional 63.3% |