South African vs Basque College, 1 year or more
COMPARE
South African
Basque
College, 1 year or more
College, 1 year or more Comparison
South Africans
Basques
64.1%
COLLEGE, 1 YEAR OR MORE
99.7/ 100
METRIC RATING
57th/ 347
METRIC RANK
60.9%
COLLEGE, 1 YEAR OR MORE
87.2/ 100
METRIC RATING
136th/ 347
METRIC RANK
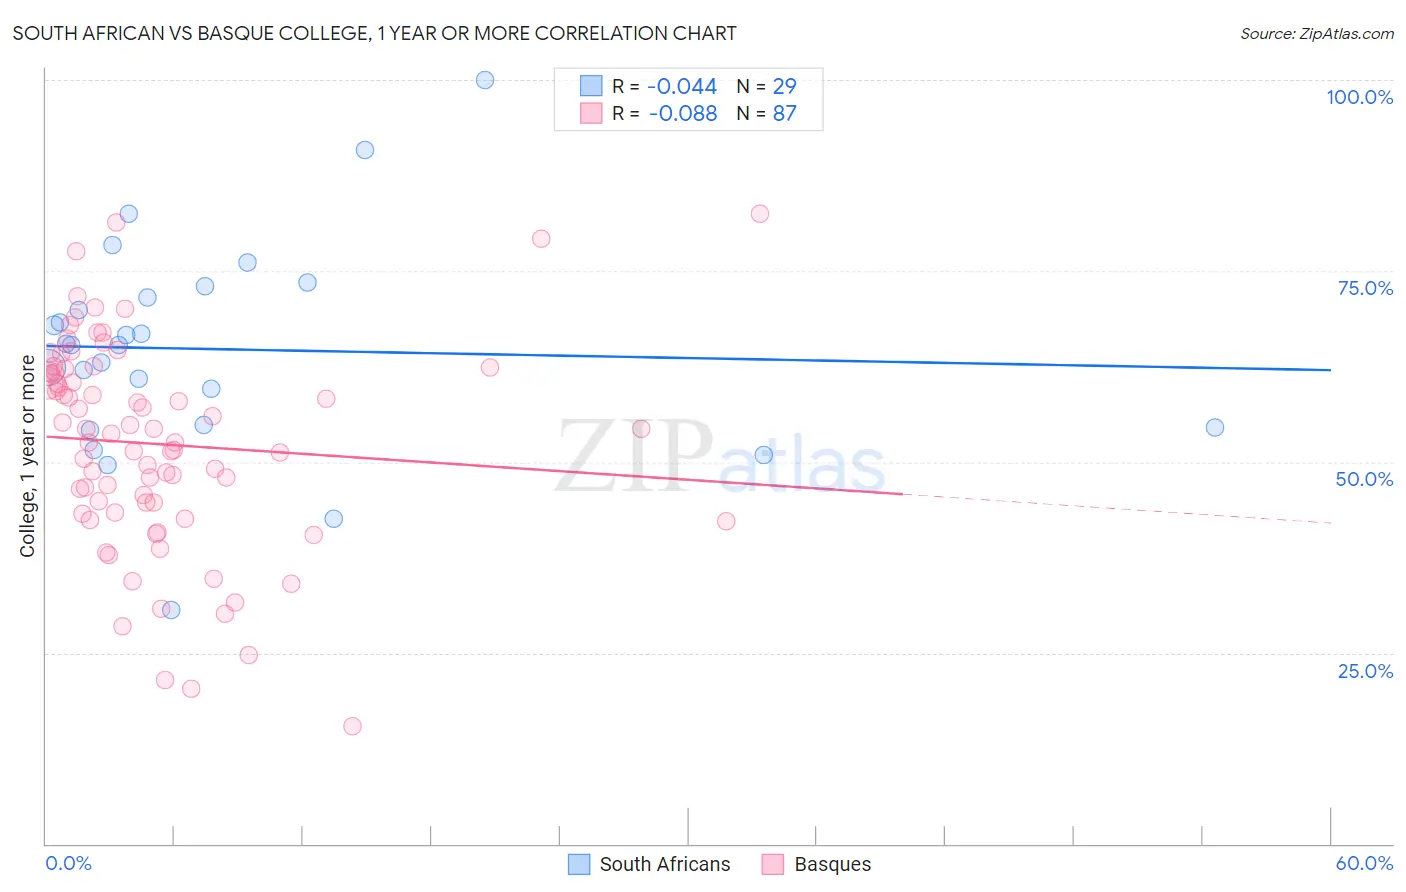
South African vs Basque College, 1 year or more Correlation Chart
The statistical analysis conducted on geographies consisting of 182,603,987 people shows no correlation between the proportion of South Africans and percentage of population with at least college, 1 year or more education in the United States with a correlation coefficient (R) of -0.044 and weighted average of 64.1%. Similarly, the statistical analysis conducted on geographies consisting of 165,778,610 people shows a slight negative correlation between the proportion of Basques and percentage of population with at least college, 1 year or more education in the United States with a correlation coefficient (R) of -0.088 and weighted average of 60.9%, a difference of 5.2%.
College, 1 year or more Correlation Summary
| Measurement | South African | Basque |
| Minimum | 30.6% | 15.4% |
| Maximum | 100.0% | 82.5% |
| Range | 69.4% | 67.1% |
| Mean | 64.8% | 52.3% |
| Median | 65.4% | 53.6% |
| Interquartile 25% (IQ1) | 54.7% | 43.4% |
| Interquartile 75% (IQ3) | 72.3% | 61.8% |
| Interquartile Range (IQR) | 17.6% | 18.4% |
| Standard Deviation (Sample) | 13.9% | 13.7% |
| Standard Deviation (Population) | 13.7% | 13.7% |
Similar Demographics by College, 1 year or more
Demographics Similar to South Africans by College, 1 year or more
In terms of college, 1 year or more, the demographic groups most similar to South Africans are Immigrants from Czechoslovakia (64.1%, a difference of 0.010%), Immigrants from Belarus (64.1%, a difference of 0.040%), Immigrants from Asia (64.0%, a difference of 0.14%), Zimbabwean (64.2%, a difference of 0.16%), and Asian (64.2%, a difference of 0.19%).
| Demographics | Rating | Rank | College, 1 year or more |
| Immigrants | Austria | 99.8 /100 | #50 | Exceptional 64.4% |
| Immigrants | Malaysia | 99.8 /100 | #51 | Exceptional 64.3% |
| Immigrants | Netherlands | 99.8 /100 | #52 | Exceptional 64.2% |
| Asians | 99.8 /100 | #53 | Exceptional 64.2% |
| Zimbabweans | 99.8 /100 | #54 | Exceptional 64.2% |
| Immigrants | Belarus | 99.7 /100 | #55 | Exceptional 64.1% |
| Immigrants | Czechoslovakia | 99.7 /100 | #56 | Exceptional 64.1% |
| South Africans | 99.7 /100 | #57 | Exceptional 64.1% |
| Immigrants | Asia | 99.7 /100 | #58 | Exceptional 64.0% |
| Immigrants | Serbia | 99.6 /100 | #59 | Exceptional 63.8% |
| Immigrants | Kazakhstan | 99.5 /100 | #60 | Exceptional 63.6% |
| Bolivians | 99.5 /100 | #61 | Exceptional 63.5% |
| Immigrants | Indonesia | 99.5 /100 | #62 | Exceptional 63.5% |
| Immigrants | Scotland | 99.4 /100 | #63 | Exceptional 63.4% |
| Immigrants | Spain | 99.4 /100 | #64 | Exceptional 63.4% |
Demographics Similar to Basques by College, 1 year or more
In terms of college, 1 year or more, the demographic groups most similar to Basques are Immigrants from Uganda (60.9%, a difference of 0.020%), Immigrants from Venezuela (61.0%, a difference of 0.080%), Immigrants from Uzbekistan (61.0%, a difference of 0.090%), Slovene (60.9%, a difference of 0.090%), and Scandinavian (61.0%, a difference of 0.12%).
| Demographics | Rating | Rank | College, 1 year or more |
| Ugandans | 90.7 /100 | #129 | Exceptional 61.2% |
| Italians | 89.5 /100 | #130 | Excellent 61.1% |
| Immigrants | Morocco | 89.5 /100 | #131 | Excellent 61.1% |
| Scandinavians | 88.2 /100 | #132 | Excellent 61.0% |
| Immigrants | Uzbekistan | 88.0 /100 | #133 | Excellent 61.0% |
| Immigrants | Venezuela | 87.9 /100 | #134 | Excellent 61.0% |
| Immigrants | Uganda | 87.4 /100 | #135 | Excellent 60.9% |
| Basques | 87.2 /100 | #136 | Excellent 60.9% |
| Slovenes | 86.5 /100 | #137 | Excellent 60.9% |
| Taiwanese | 84.3 /100 | #138 | Excellent 60.7% |
| Immigrants | Eritrea | 84.3 /100 | #139 | Excellent 60.7% |
| Iraqis | 83.3 /100 | #140 | Excellent 60.7% |
| Immigrants | Afghanistan | 83.1 /100 | #141 | Excellent 60.7% |
| Poles | 82.8 /100 | #142 | Excellent 60.7% |
| Canadians | 82.7 /100 | #143 | Excellent 60.6% |