South African vs Immigrants from Mexico College, 1 year or more
COMPARE
South African
Immigrants from Mexico
College, 1 year or more
College, 1 year or more Comparison
South Africans
Immigrants from Mexico
64.1%
COLLEGE, 1 YEAR OR MORE
99.7/ 100
METRIC RATING
57th/ 347
METRIC RANK
47.5%
COLLEGE, 1 YEAR OR MORE
0.0/ 100
METRIC RATING
341st/ 347
METRIC RANK
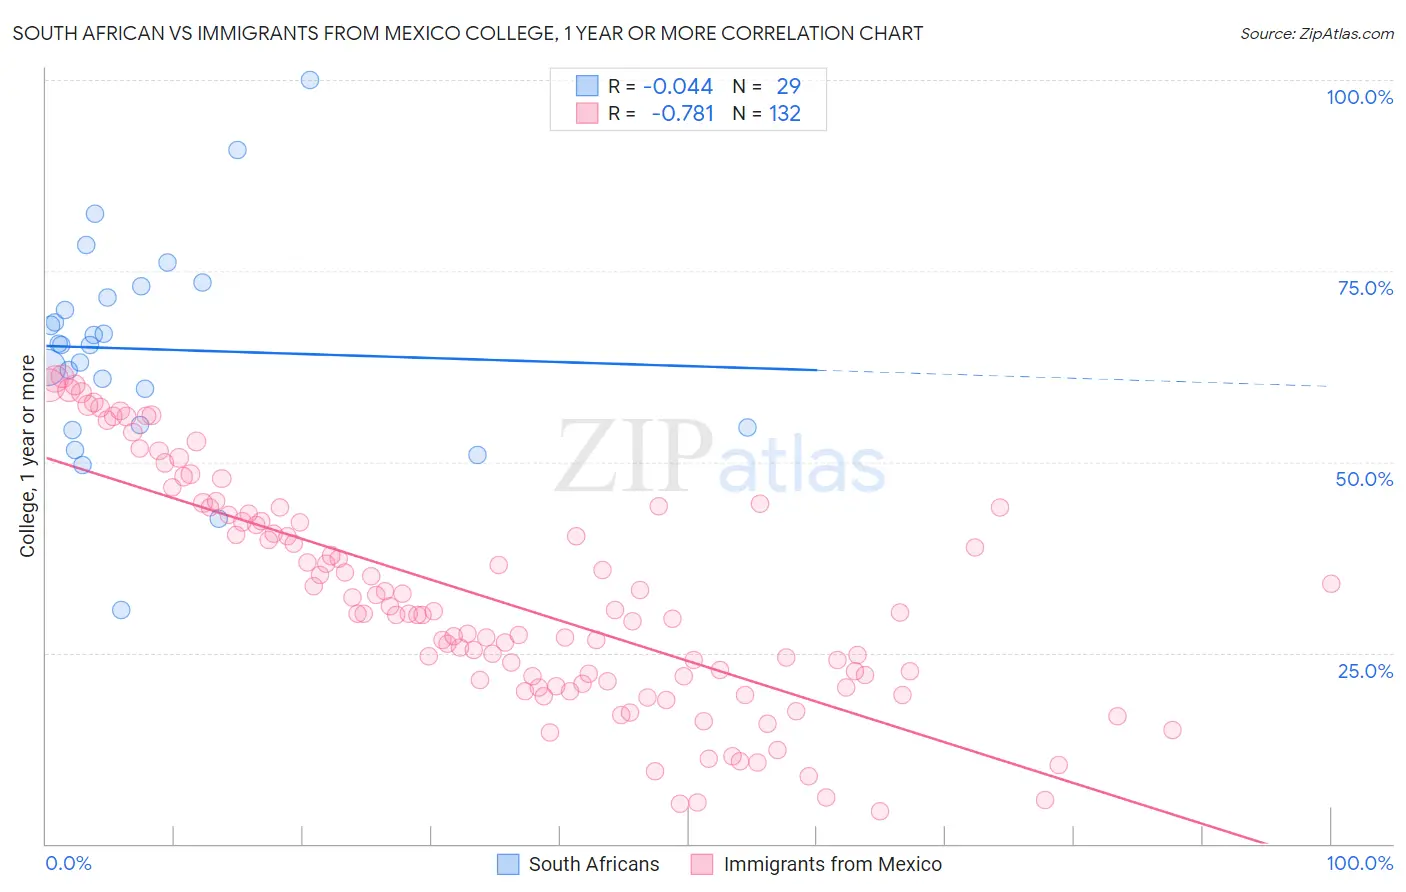
South African vs Immigrants from Mexico College, 1 year or more Correlation Chart
The statistical analysis conducted on geographies consisting of 182,603,987 people shows no correlation between the proportion of South Africans and percentage of population with at least college, 1 year or more education in the United States with a correlation coefficient (R) of -0.044 and weighted average of 64.1%. Similarly, the statistical analysis conducted on geographies consisting of 513,754,455 people shows a strong negative correlation between the proportion of Immigrants from Mexico and percentage of population with at least college, 1 year or more education in the United States with a correlation coefficient (R) of -0.781 and weighted average of 47.5%, a difference of 34.9%.
College, 1 year or more Correlation Summary
| Measurement | South African | Immigrants from Mexico |
| Minimum | 30.6% | 4.2% |
| Maximum | 100.0% | 61.3% |
| Range | 69.4% | 57.1% |
| Mean | 64.8% | 32.2% |
| Median | 65.4% | 30.2% |
| Interquartile 25% (IQ1) | 54.7% | 21.3% |
| Interquartile 75% (IQ3) | 72.3% | 43.2% |
| Interquartile Range (IQR) | 17.6% | 21.9% |
| Standard Deviation (Sample) | 13.9% | 14.7% |
| Standard Deviation (Population) | 13.7% | 14.7% |
Similar Demographics by College, 1 year or more
Demographics Similar to South Africans by College, 1 year or more
In terms of college, 1 year or more, the demographic groups most similar to South Africans are Immigrants from Czechoslovakia (64.1%, a difference of 0.010%), Immigrants from Belarus (64.1%, a difference of 0.040%), Immigrants from Asia (64.0%, a difference of 0.14%), Zimbabwean (64.2%, a difference of 0.16%), and Asian (64.2%, a difference of 0.19%).
| Demographics | Rating | Rank | College, 1 year or more |
| Immigrants | Austria | 99.8 /100 | #50 | Exceptional 64.4% |
| Immigrants | Malaysia | 99.8 /100 | #51 | Exceptional 64.3% |
| Immigrants | Netherlands | 99.8 /100 | #52 | Exceptional 64.2% |
| Asians | 99.8 /100 | #53 | Exceptional 64.2% |
| Zimbabweans | 99.8 /100 | #54 | Exceptional 64.2% |
| Immigrants | Belarus | 99.7 /100 | #55 | Exceptional 64.1% |
| Immigrants | Czechoslovakia | 99.7 /100 | #56 | Exceptional 64.1% |
| South Africans | 99.7 /100 | #57 | Exceptional 64.1% |
| Immigrants | Asia | 99.7 /100 | #58 | Exceptional 64.0% |
| Immigrants | Serbia | 99.6 /100 | #59 | Exceptional 63.8% |
| Immigrants | Kazakhstan | 99.5 /100 | #60 | Exceptional 63.6% |
| Bolivians | 99.5 /100 | #61 | Exceptional 63.5% |
| Immigrants | Indonesia | 99.5 /100 | #62 | Exceptional 63.5% |
| Immigrants | Scotland | 99.4 /100 | #63 | Exceptional 63.4% |
| Immigrants | Spain | 99.4 /100 | #64 | Exceptional 63.4% |
Demographics Similar to Immigrants from Mexico by College, 1 year or more
In terms of college, 1 year or more, the demographic groups most similar to Immigrants from Mexico are Inupiat (47.2%, a difference of 0.57%), Tohono O'odham (47.1%, a difference of 0.79%), Immigrants from Cabo Verde (48.1%, a difference of 1.2%), Immigrants from the Azores (48.4%, a difference of 1.8%), and Immigrants from Central America (48.5%, a difference of 2.0%).
| Demographics | Rating | Rank | College, 1 year or more |
| Immigrants | Dominican Republic | 0.0 /100 | #333 | Tragic 49.1% |
| Lumbee | 0.0 /100 | #334 | Tragic 48.9% |
| Yuman | 0.0 /100 | #335 | Tragic 48.7% |
| Spanish American Indians | 0.0 /100 | #336 | Tragic 48.5% |
| Pennsylvania Germans | 0.0 /100 | #337 | Tragic 48.5% |
| Immigrants | Central America | 0.0 /100 | #338 | Tragic 48.5% |
| Immigrants | Azores | 0.0 /100 | #339 | Tragic 48.4% |
| Immigrants | Cabo Verde | 0.0 /100 | #340 | Tragic 48.1% |
| Immigrants | Mexico | 0.0 /100 | #341 | Tragic 47.5% |
| Inupiat | 0.0 /100 | #342 | Tragic 47.2% |
| Tohono O'odham | 0.0 /100 | #343 | Tragic 47.1% |
| Yakama | 0.0 /100 | #344 | Tragic 46.2% |
| Pima | 0.0 /100 | #345 | Tragic 45.6% |
| Houma | 0.0 /100 | #346 | Tragic 41.2% |
| Yup'ik | 0.0 /100 | #347 | Tragic 39.4% |