South African vs German College, 1 year or more
COMPARE
South African
German
College, 1 year or more
College, 1 year or more Comparison
South Africans
Germans
64.1%
COLLEGE, 1 YEAR OR MORE
99.7/ 100
METRIC RATING
57th/ 347
METRIC RANK
58.9%
COLLEGE, 1 YEAR OR MORE
34.7/ 100
METRIC RATING
187th/ 347
METRIC RANK
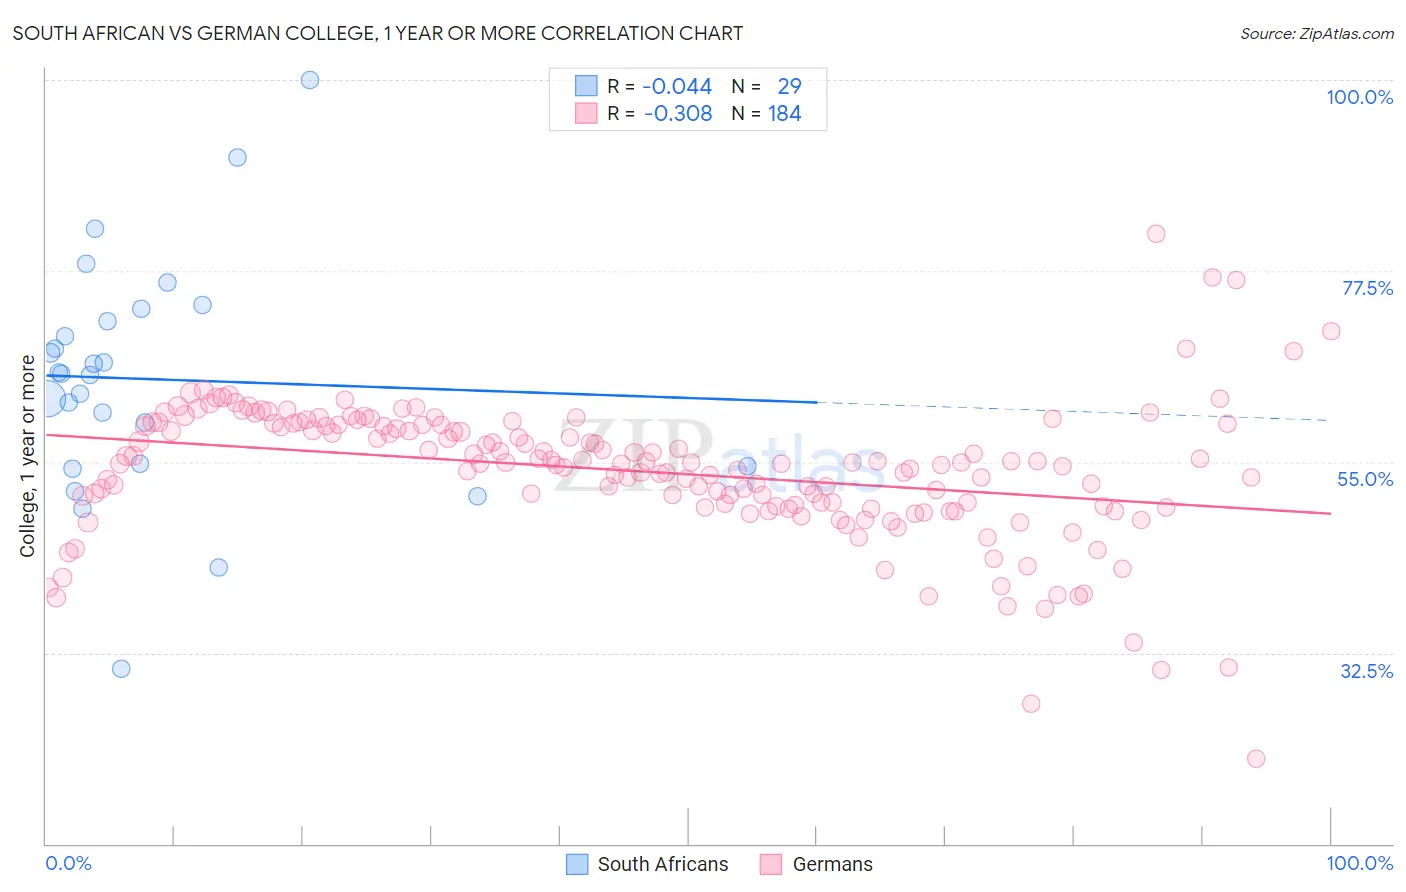
South African vs German College, 1 year or more Correlation Chart
The statistical analysis conducted on geographies consisting of 182,603,987 people shows no correlation between the proportion of South Africans and percentage of population with at least college, 1 year or more education in the United States with a correlation coefficient (R) of -0.044 and weighted average of 64.1%. Similarly, the statistical analysis conducted on geographies consisting of 581,271,731 people shows a mild negative correlation between the proportion of Germans and percentage of population with at least college, 1 year or more education in the United States with a correlation coefficient (R) of -0.308 and weighted average of 58.9%, a difference of 8.8%.
College, 1 year or more Correlation Summary
| Measurement | South African | German |
| Minimum | 30.6% | 20.0% |
| Maximum | 100.0% | 81.8% |
| Range | 69.4% | 61.8% |
| Mean | 64.8% | 53.9% |
| Median | 65.4% | 54.9% |
| Interquartile 25% (IQ1) | 54.7% | 49.8% |
| Interquartile 75% (IQ3) | 72.3% | 59.4% |
| Interquartile Range (IQR) | 17.6% | 9.6% |
| Standard Deviation (Sample) | 13.9% | 8.2% |
| Standard Deviation (Population) | 13.7% | 8.1% |
Similar Demographics by College, 1 year or more
Demographics Similar to South Africans by College, 1 year or more
In terms of college, 1 year or more, the demographic groups most similar to South Africans are Immigrants from Czechoslovakia (64.1%, a difference of 0.010%), Immigrants from Belarus (64.1%, a difference of 0.040%), Immigrants from Asia (64.0%, a difference of 0.14%), Zimbabwean (64.2%, a difference of 0.16%), and Asian (64.2%, a difference of 0.19%).
| Demographics | Rating | Rank | College, 1 year or more |
| Immigrants | Austria | 99.8 /100 | #50 | Exceptional 64.4% |
| Immigrants | Malaysia | 99.8 /100 | #51 | Exceptional 64.3% |
| Immigrants | Netherlands | 99.8 /100 | #52 | Exceptional 64.2% |
| Asians | 99.8 /100 | #53 | Exceptional 64.2% |
| Zimbabweans | 99.8 /100 | #54 | Exceptional 64.2% |
| Immigrants | Belarus | 99.7 /100 | #55 | Exceptional 64.1% |
| Immigrants | Czechoslovakia | 99.7 /100 | #56 | Exceptional 64.1% |
| South Africans | 99.7 /100 | #57 | Exceptional 64.1% |
| Immigrants | Asia | 99.7 /100 | #58 | Exceptional 64.0% |
| Immigrants | Serbia | 99.6 /100 | #59 | Exceptional 63.8% |
| Immigrants | Kazakhstan | 99.5 /100 | #60 | Exceptional 63.6% |
| Bolivians | 99.5 /100 | #61 | Exceptional 63.5% |
| Immigrants | Indonesia | 99.5 /100 | #62 | Exceptional 63.5% |
| Immigrants | Scotland | 99.4 /100 | #63 | Exceptional 63.4% |
| Immigrants | Spain | 99.4 /100 | #64 | Exceptional 63.4% |
Demographics Similar to Germans by College, 1 year or more
In terms of college, 1 year or more, the demographic groups most similar to Germans are Scotch-Irish (58.9%, a difference of 0.0%), French (58.9%, a difference of 0.020%), South American (59.0%, a difference of 0.070%), Uruguayan (58.8%, a difference of 0.17%), and Spaniard (59.0%, a difference of 0.21%).
| Demographics | Rating | Rank | College, 1 year or more |
| Yugoslavians | 44.1 /100 | #180 | Average 59.2% |
| Swiss | 43.4 /100 | #181 | Average 59.2% |
| Immigrants | Bosnia and Herzegovina | 42.8 /100 | #182 | Average 59.2% |
| German Russians | 39.3 /100 | #183 | Fair 59.1% |
| Spaniards | 38.3 /100 | #184 | Fair 59.0% |
| South Americans | 35.9 /100 | #185 | Fair 59.0% |
| Scotch-Irish | 34.7 /100 | #186 | Fair 58.9% |
| Germans | 34.7 /100 | #187 | Fair 58.9% |
| French | 34.4 /100 | #188 | Fair 58.9% |
| Uruguayans | 31.8 /100 | #189 | Fair 58.8% |
| Immigrants | Cameroon | 31.2 /100 | #190 | Fair 58.8% |
| Immigrants | Philippines | 29.2 /100 | #191 | Fair 58.7% |
| Colombians | 27.6 /100 | #192 | Fair 58.7% |
| Peruvians | 27.5 /100 | #193 | Fair 58.6% |
| Costa Ricans | 26.4 /100 | #194 | Fair 58.6% |