Ute vs Immigrants from Syria College, 1 year or more
COMPARE
Ute
Immigrants from Syria
College, 1 year or more
College, 1 year or more Comparison
Ute
Immigrants from Syria
53.8%
COLLEGE, 1 YEAR OR MORE
0.1/ 100
METRIC RATING
284th/ 347
METRIC RANK
61.3%
COLLEGE, 1 YEAR OR MORE
91.6/ 100
METRIC RATING
125th/ 347
METRIC RANK
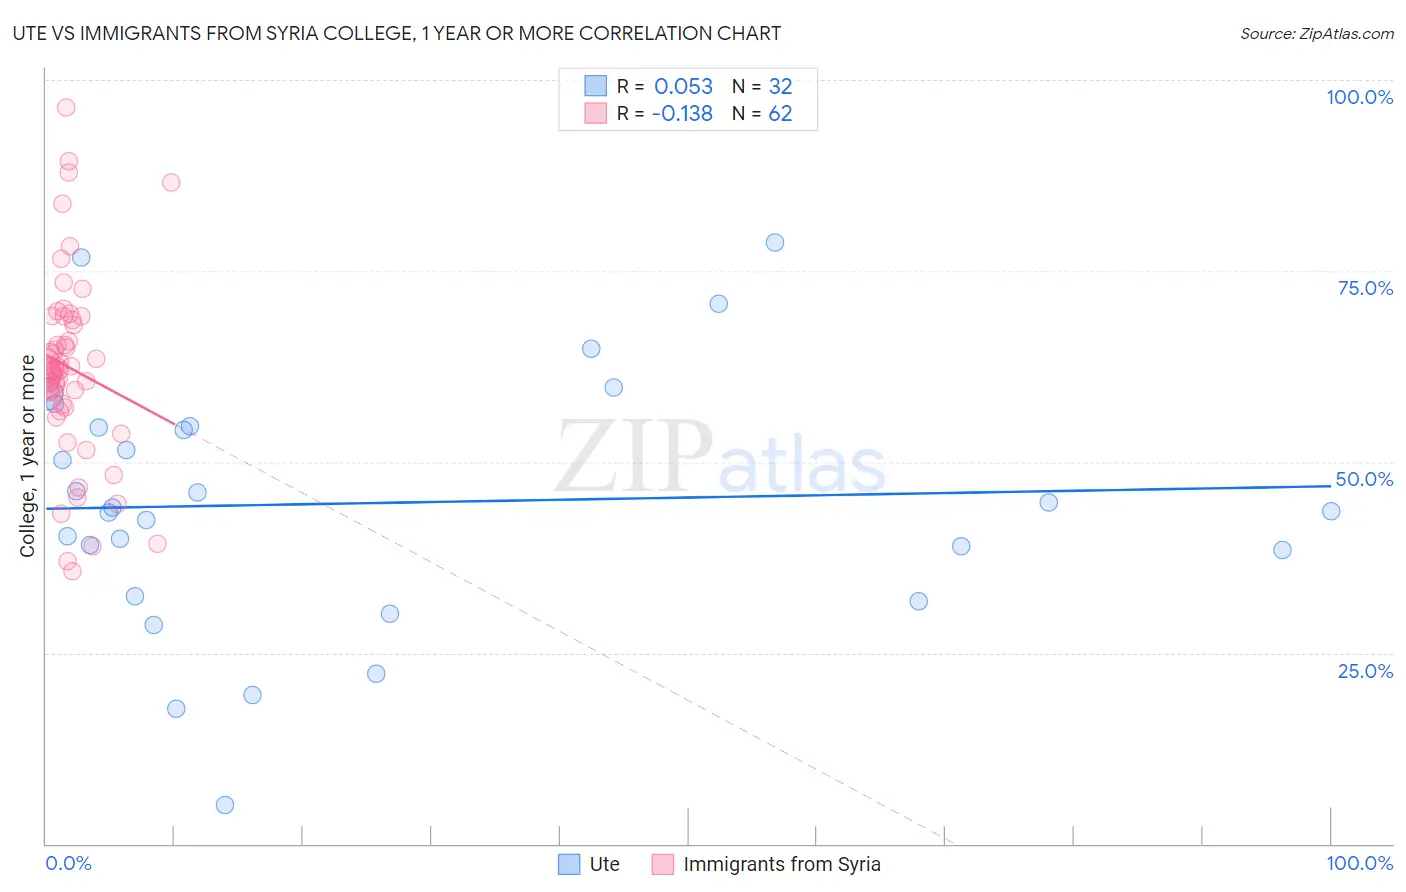
Ute vs Immigrants from Syria College, 1 year or more Correlation Chart
The statistical analysis conducted on geographies consisting of 55,668,599 people shows a slight positive correlation between the proportion of Ute and percentage of population with at least college, 1 year or more education in the United States with a correlation coefficient (R) of 0.053 and weighted average of 53.8%. Similarly, the statistical analysis conducted on geographies consisting of 174,109,130 people shows a poor negative correlation between the proportion of Immigrants from Syria and percentage of population with at least college, 1 year or more education in the United States with a correlation coefficient (R) of -0.138 and weighted average of 61.3%, a difference of 13.9%.
College, 1 year or more Correlation Summary
| Measurement | Ute | Immigrants from Syria |
| Minimum | 5.1% | 35.7% |
| Maximum | 78.7% | 96.4% |
| Range | 73.6% | 60.7% |
| Mean | 44.6% | 62.3% |
| Median | 43.8% | 62.1% |
| Interquartile 25% (IQ1) | 35.4% | 57.5% |
| Interquartile 75% (IQ3) | 54.6% | 68.5% |
| Interquartile Range (IQR) | 19.2% | 11.0% |
| Standard Deviation (Sample) | 16.7% | 12.2% |
| Standard Deviation (Population) | 16.4% | 12.1% |
Similar Demographics by College, 1 year or more
Demographics Similar to Ute by College, 1 year or more
In terms of college, 1 year or more, the demographic groups most similar to Ute are Nicaraguan (53.9%, a difference of 0.17%), Immigrants from Guyana (53.5%, a difference of 0.46%), Central American Indian (53.5%, a difference of 0.51%), Guyanese (54.1%, a difference of 0.53%), and Immigrants from Belize (53.5%, a difference of 0.54%).
| Demographics | Rating | Rank | College, 1 year or more |
| Ecuadorians | 0.2 /100 | #277 | Tragic 54.3% |
| Immigrants | Jamaica | 0.1 /100 | #278 | Tragic 54.2% |
| Arapaho | 0.1 /100 | #279 | Tragic 54.1% |
| Cheyenne | 0.1 /100 | #280 | Tragic 54.1% |
| Colville | 0.1 /100 | #281 | Tragic 54.1% |
| Guyanese | 0.1 /100 | #282 | Tragic 54.1% |
| Nicaraguans | 0.1 /100 | #283 | Tragic 53.9% |
| Ute | 0.1 /100 | #284 | Tragic 53.8% |
| Immigrants | Guyana | 0.1 /100 | #285 | Tragic 53.5% |
| Central American Indians | 0.1 /100 | #286 | Tragic 53.5% |
| Immigrants | Belize | 0.1 /100 | #287 | Tragic 53.5% |
| Alaska Natives | 0.0 /100 | #288 | Tragic 53.4% |
| Immigrants | Ecuador | 0.0 /100 | #289 | Tragic 53.4% |
| Alaskan Athabascans | 0.0 /100 | #290 | Tragic 53.4% |
| Cubans | 0.0 /100 | #291 | Tragic 53.4% |
Demographics Similar to Immigrants from Syria by College, 1 year or more
In terms of college, 1 year or more, the demographic groups most similar to Immigrants from Syria are Alsatian (61.3%, a difference of 0.050%), Immigrants from Eastern Africa (61.2%, a difference of 0.070%), Venezuelan (61.3%, a difference of 0.080%), Immigrants from Italy (61.2%, a difference of 0.080%), and Serbian (61.4%, a difference of 0.11%).
| Demographics | Rating | Rank | College, 1 year or more |
| Immigrants | Brazil | 93.9 /100 | #118 | Exceptional 61.6% |
| Assyrians/Chaldeans/Syriacs | 93.3 /100 | #119 | Exceptional 61.5% |
| Pakistanis | 93.2 /100 | #120 | Exceptional 61.5% |
| Immigrants | Jordan | 92.7 /100 | #121 | Exceptional 61.4% |
| Immigrants | Chile | 92.3 /100 | #122 | Exceptional 61.4% |
| Serbians | 92.2 /100 | #123 | Exceptional 61.4% |
| Venezuelans | 92.1 /100 | #124 | Exceptional 61.3% |
| Immigrants | Syria | 91.6 /100 | #125 | Exceptional 61.3% |
| Alsatians | 91.3 /100 | #126 | Exceptional 61.3% |
| Immigrants | Eastern Africa | 91.1 /100 | #127 | Exceptional 61.2% |
| Immigrants | Italy | 91.1 /100 | #128 | Exceptional 61.2% |
| Ugandans | 90.7 /100 | #129 | Exceptional 61.2% |
| Italians | 89.5 /100 | #130 | Excellent 61.1% |
| Immigrants | Morocco | 89.5 /100 | #131 | Excellent 61.1% |
| Scandinavians | 88.2 /100 | #132 | Excellent 61.0% |