South African vs West Indian College, 1 year or more
COMPARE
South African
West Indian
College, 1 year or more
College, 1 year or more Comparison
South Africans
West Indians
64.1%
COLLEGE, 1 YEAR OR MORE
99.7/ 100
METRIC RATING
57th/ 347
METRIC RANK
56.3%
COLLEGE, 1 YEAR OR MORE
1.8/ 100
METRIC RATING
235th/ 347
METRIC RANK
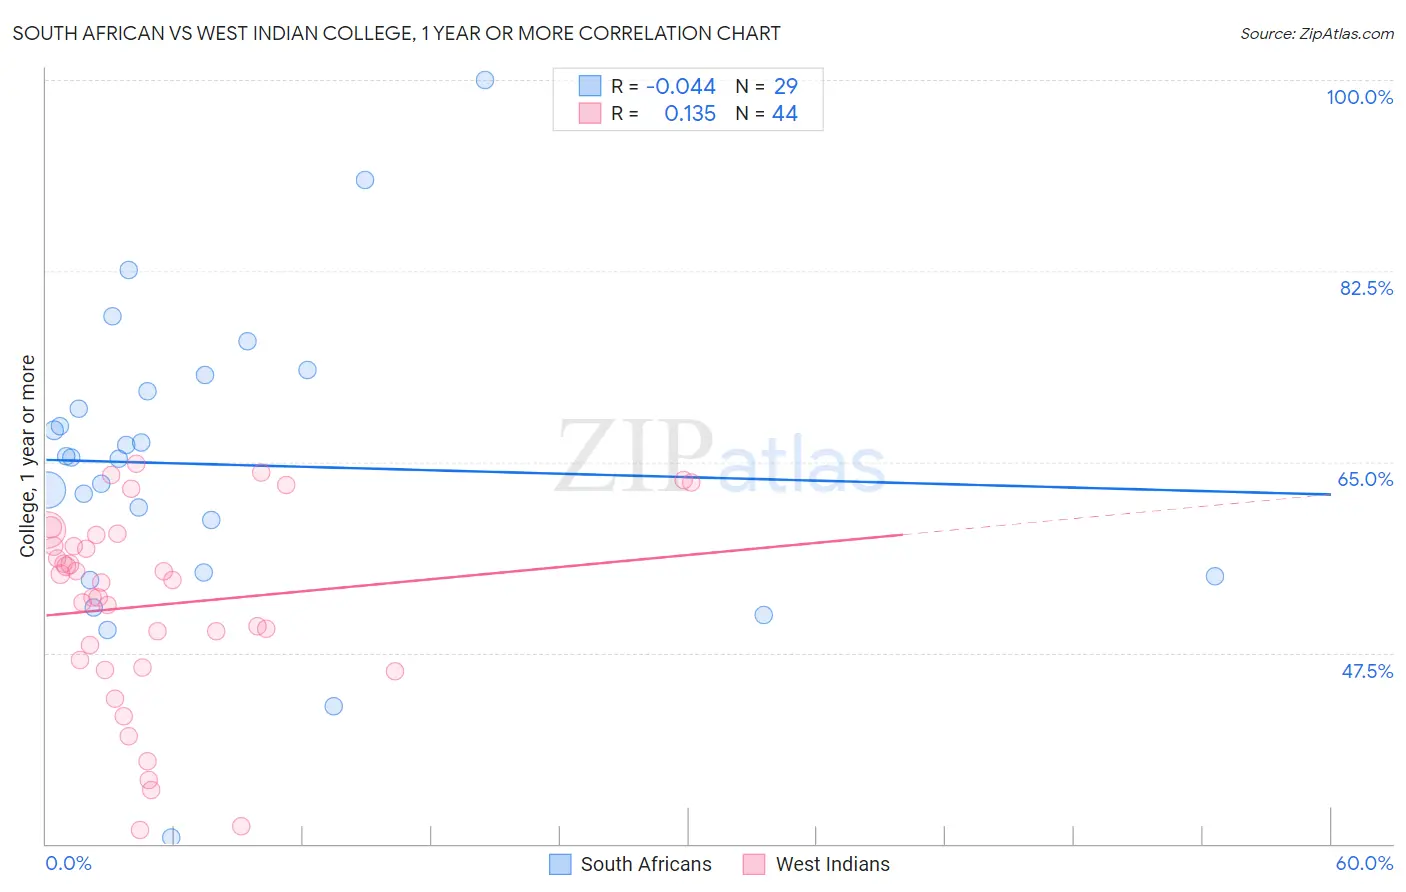
South African vs West Indian College, 1 year or more Correlation Chart
The statistical analysis conducted on geographies consisting of 182,603,987 people shows no correlation between the proportion of South Africans and percentage of population with at least college, 1 year or more education in the United States with a correlation coefficient (R) of -0.044 and weighted average of 64.1%. Similarly, the statistical analysis conducted on geographies consisting of 254,063,654 people shows a poor positive correlation between the proportion of West Indians and percentage of population with at least college, 1 year or more education in the United States with a correlation coefficient (R) of 0.135 and weighted average of 56.3%, a difference of 13.9%.
College, 1 year or more Correlation Summary
| Measurement | South African | West Indian |
| Minimum | 30.6% | 31.2% |
| Maximum | 100.0% | 64.8% |
| Range | 69.4% | 33.6% |
| Mean | 64.8% | 51.9% |
| Median | 65.4% | 54.1% |
| Interquartile 25% (IQ1) | 54.7% | 46.5% |
| Interquartile 75% (IQ3) | 72.3% | 57.8% |
| Interquartile Range (IQR) | 17.6% | 11.3% |
| Standard Deviation (Sample) | 13.9% | 8.9% |
| Standard Deviation (Population) | 13.7% | 8.8% |
Similar Demographics by College, 1 year or more
Demographics Similar to South Africans by College, 1 year or more
In terms of college, 1 year or more, the demographic groups most similar to South Africans are Immigrants from Czechoslovakia (64.1%, a difference of 0.010%), Immigrants from Belarus (64.1%, a difference of 0.040%), Immigrants from Asia (64.0%, a difference of 0.14%), Zimbabwean (64.2%, a difference of 0.16%), and Asian (64.2%, a difference of 0.19%).
| Demographics | Rating | Rank | College, 1 year or more |
| Immigrants | Austria | 99.8 /100 | #50 | Exceptional 64.4% |
| Immigrants | Malaysia | 99.8 /100 | #51 | Exceptional 64.3% |
| Immigrants | Netherlands | 99.8 /100 | #52 | Exceptional 64.2% |
| Asians | 99.8 /100 | #53 | Exceptional 64.2% |
| Zimbabweans | 99.8 /100 | #54 | Exceptional 64.2% |
| Immigrants | Belarus | 99.7 /100 | #55 | Exceptional 64.1% |
| Immigrants | Czechoslovakia | 99.7 /100 | #56 | Exceptional 64.1% |
| South Africans | 99.7 /100 | #57 | Exceptional 64.1% |
| Immigrants | Asia | 99.7 /100 | #58 | Exceptional 64.0% |
| Immigrants | Serbia | 99.6 /100 | #59 | Exceptional 63.8% |
| Immigrants | Kazakhstan | 99.5 /100 | #60 | Exceptional 63.6% |
| Bolivians | 99.5 /100 | #61 | Exceptional 63.5% |
| Immigrants | Indonesia | 99.5 /100 | #62 | Exceptional 63.5% |
| Immigrants | Scotland | 99.4 /100 | #63 | Exceptional 63.4% |
| Immigrants | Spain | 99.4 /100 | #64 | Exceptional 63.4% |
Demographics Similar to West Indians by College, 1 year or more
In terms of college, 1 year or more, the demographic groups most similar to West Indians are Spanish American (56.3%, a difference of 0.0%), Iroquois (56.2%, a difference of 0.050%), Samoan (56.2%, a difference of 0.16%), Barbadian (56.0%, a difference of 0.43%), and Nonimmigrants (56.5%, a difference of 0.45%).
| Demographics | Rating | Rank | College, 1 year or more |
| Immigrants | Fiji | 4.0 /100 | #228 | Tragic 56.9% |
| Cree | 3.6 /100 | #229 | Tragic 56.8% |
| Liberians | 3.1 /100 | #230 | Tragic 56.7% |
| Immigrants | Burma/Myanmar | 2.7 /100 | #231 | Tragic 56.6% |
| Immigrants | Bangladesh | 2.6 /100 | #232 | Tragic 56.6% |
| Immigrants | Nonimmigrants | 2.5 /100 | #233 | Tragic 56.5% |
| Spanish Americans | 1.8 /100 | #234 | Tragic 56.3% |
| West Indians | 1.8 /100 | #235 | Tragic 56.3% |
| Iroquois | 1.7 /100 | #236 | Tragic 56.2% |
| Samoans | 1.6 /100 | #237 | Tragic 56.2% |
| Barbadians | 1.3 /100 | #238 | Tragic 56.0% |
| Puget Sound Salish | 1.1 /100 | #239 | Tragic 55.9% |
| Trinidadians and Tobagonians | 1.1 /100 | #240 | Tragic 55.8% |
| French American Indians | 1.0 /100 | #241 | Tragic 55.8% |
| Marshallese | 1.0 /100 | #242 | Tragic 55.8% |