Immigrants from St. Vincent and the Grenadines vs Immigrants from Mexico College, 1 year or more
COMPARE
Immigrants from St. Vincent and the Grenadines
Immigrants from Mexico
College, 1 year or more
College, 1 year or more Comparison
Immigrants from St. Vincent and the Grenadines
Immigrants from Mexico
54.8%
COLLEGE, 1 YEAR OR MORE
0.3/ 100
METRIC RATING
262nd/ 347
METRIC RANK
47.5%
COLLEGE, 1 YEAR OR MORE
0.0/ 100
METRIC RATING
341st/ 347
METRIC RANK
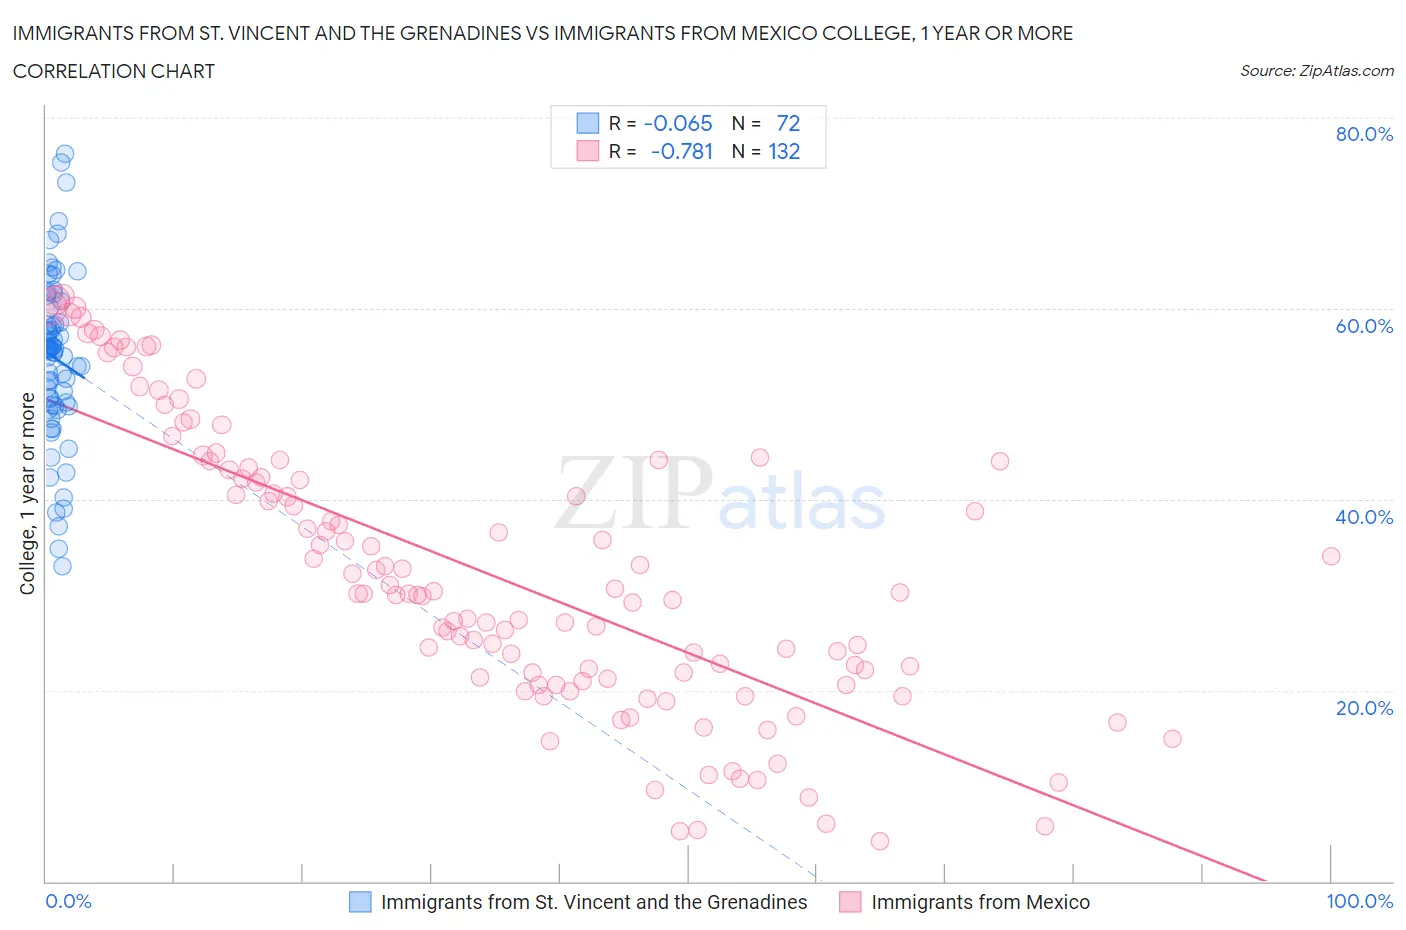
Immigrants from St. Vincent and the Grenadines vs Immigrants from Mexico College, 1 year or more Correlation Chart
The statistical analysis conducted on geographies consisting of 56,185,220 people shows a slight negative correlation between the proportion of Immigrants from St. Vincent and the Grenadines and percentage of population with at least college, 1 year or more education in the United States with a correlation coefficient (R) of -0.065 and weighted average of 54.8%. Similarly, the statistical analysis conducted on geographies consisting of 513,754,455 people shows a strong negative correlation between the proportion of Immigrants from Mexico and percentage of population with at least college, 1 year or more education in the United States with a correlation coefficient (R) of -0.781 and weighted average of 47.5%, a difference of 15.4%.
College, 1 year or more Correlation Summary
| Measurement | Immigrants from St. Vincent and the Grenadines | Immigrants from Mexico |
| Minimum | 33.0% | 4.2% |
| Maximum | 76.2% | 61.3% |
| Range | 43.2% | 57.1% |
| Mean | 54.8% | 32.2% |
| Median | 55.6% | 30.2% |
| Interquartile 25% (IQ1) | 49.8% | 21.3% |
| Interquartile 75% (IQ3) | 59.3% | 43.2% |
| Interquartile Range (IQR) | 9.5% | 21.9% |
| Standard Deviation (Sample) | 8.8% | 14.7% |
| Standard Deviation (Population) | 8.7% | 14.7% |
Similar Demographics by College, 1 year or more
Demographics Similar to Immigrants from St. Vincent and the Grenadines by College, 1 year or more
In terms of college, 1 year or more, the demographic groups most similar to Immigrants from St. Vincent and the Grenadines are U.S. Virgin Islander (54.8%, a difference of 0.020%), Immigrants from Micronesia (54.8%, a difference of 0.050%), Ottawa (54.9%, a difference of 0.080%), Jamaican (54.9%, a difference of 0.11%), and Nepalese (54.9%, a difference of 0.21%).
| Demographics | Rating | Rank | College, 1 year or more |
| Immigrants | Bahamas | 0.5 /100 | #255 | Tragic 55.2% |
| Immigrants | West Indies | 0.5 /100 | #256 | Tragic 55.2% |
| Indonesians | 0.4 /100 | #257 | Tragic 55.1% |
| Africans | 0.4 /100 | #258 | Tragic 55.0% |
| Nepalese | 0.3 /100 | #259 | Tragic 54.9% |
| Jamaicans | 0.3 /100 | #260 | Tragic 54.9% |
| Ottawa | 0.3 /100 | #261 | Tragic 54.9% |
| Immigrants | St. Vincent and the Grenadines | 0.3 /100 | #262 | Tragic 54.8% |
| U.S. Virgin Islanders | 0.3 /100 | #263 | Tragic 54.8% |
| Immigrants | Micronesia | 0.3 /100 | #264 | Tragic 54.8% |
| Immigrants | Laos | 0.2 /100 | #265 | Tragic 54.7% |
| Potawatomi | 0.2 /100 | #266 | Tragic 54.6% |
| Blackfeet | 0.2 /100 | #267 | Tragic 54.6% |
| British West Indians | 0.2 /100 | #268 | Tragic 54.5% |
| Bangladeshis | 0.2 /100 | #269 | Tragic 54.5% |
Demographics Similar to Immigrants from Mexico by College, 1 year or more
In terms of college, 1 year or more, the demographic groups most similar to Immigrants from Mexico are Inupiat (47.2%, a difference of 0.57%), Tohono O'odham (47.1%, a difference of 0.79%), Immigrants from Cabo Verde (48.1%, a difference of 1.2%), Immigrants from the Azores (48.4%, a difference of 1.8%), and Immigrants from Central America (48.5%, a difference of 2.0%).
| Demographics | Rating | Rank | College, 1 year or more |
| Immigrants | Dominican Republic | 0.0 /100 | #333 | Tragic 49.1% |
| Lumbee | 0.0 /100 | #334 | Tragic 48.9% |
| Yuman | 0.0 /100 | #335 | Tragic 48.7% |
| Spanish American Indians | 0.0 /100 | #336 | Tragic 48.5% |
| Pennsylvania Germans | 0.0 /100 | #337 | Tragic 48.5% |
| Immigrants | Central America | 0.0 /100 | #338 | Tragic 48.5% |
| Immigrants | Azores | 0.0 /100 | #339 | Tragic 48.4% |
| Immigrants | Cabo Verde | 0.0 /100 | #340 | Tragic 48.1% |
| Immigrants | Mexico | 0.0 /100 | #341 | Tragic 47.5% |
| Inupiat | 0.0 /100 | #342 | Tragic 47.2% |
| Tohono O'odham | 0.0 /100 | #343 | Tragic 47.1% |
| Yakama | 0.0 /100 | #344 | Tragic 46.2% |
| Pima | 0.0 /100 | #345 | Tragic 45.6% |
| Houma | 0.0 /100 | #346 | Tragic 41.2% |
| Yup'ik | 0.0 /100 | #347 | Tragic 39.4% |