Arapaho vs Immigrants from Mexico College, 1 year or more
COMPARE
Arapaho
Immigrants from Mexico
College, 1 year or more
College, 1 year or more Comparison
Arapaho
Immigrants from Mexico
54.1%
COLLEGE, 1 YEAR OR MORE
0.1/ 100
METRIC RATING
279th/ 347
METRIC RANK
47.5%
COLLEGE, 1 YEAR OR MORE
0.0/ 100
METRIC RATING
341st/ 347
METRIC RANK
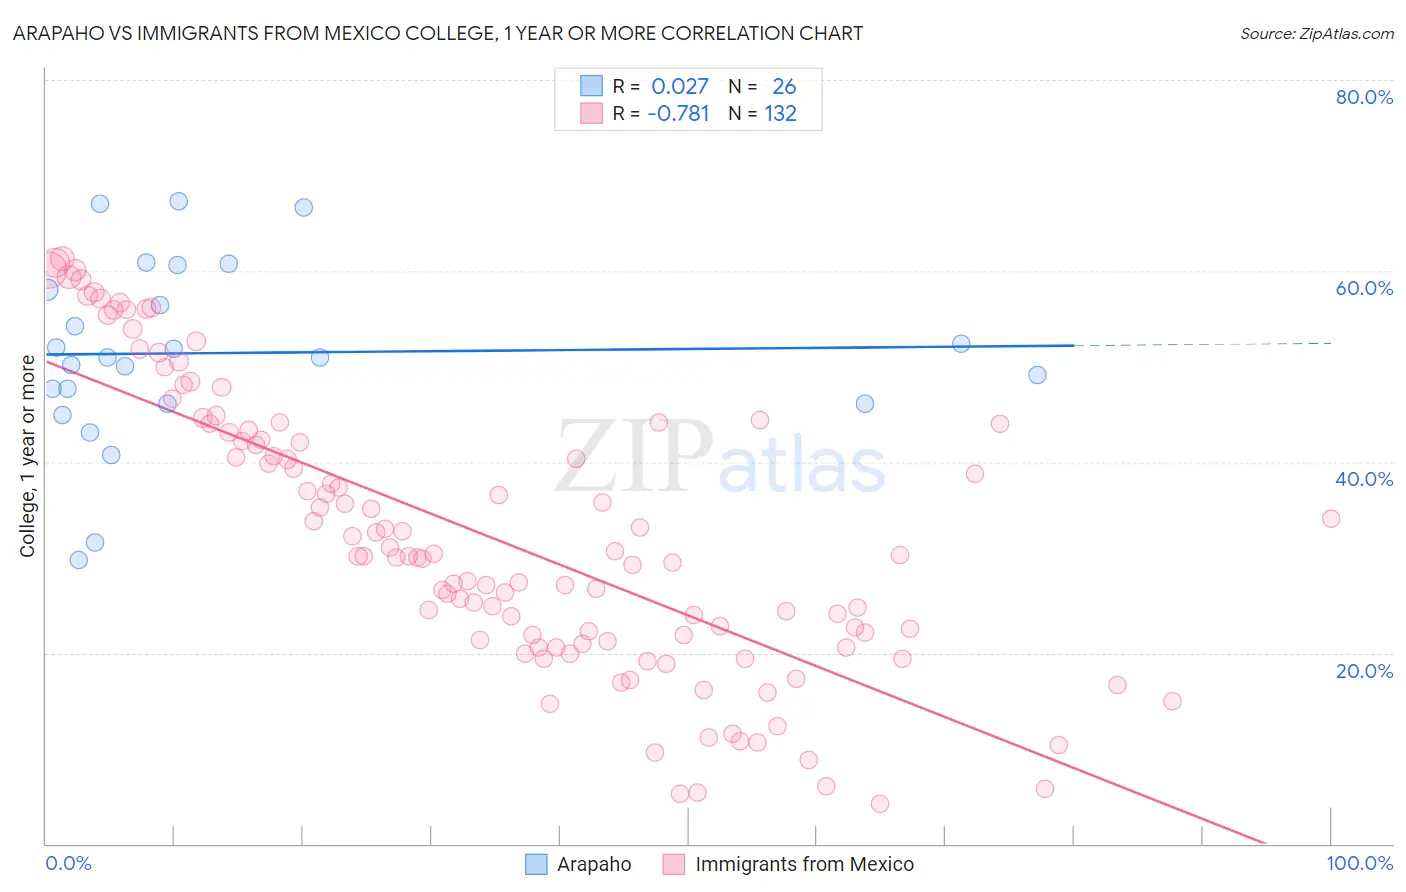
Arapaho vs Immigrants from Mexico College, 1 year or more Correlation Chart
The statistical analysis conducted on geographies consisting of 29,780,040 people shows no correlation between the proportion of Arapaho and percentage of population with at least college, 1 year or more education in the United States with a correlation coefficient (R) of 0.027 and weighted average of 54.1%. Similarly, the statistical analysis conducted on geographies consisting of 513,754,455 people shows a strong negative correlation between the proportion of Immigrants from Mexico and percentage of population with at least college, 1 year or more education in the United States with a correlation coefficient (R) of -0.781 and weighted average of 47.5%, a difference of 14.0%.
College, 1 year or more Correlation Summary
| Measurement | Arapaho | Immigrants from Mexico |
| Minimum | 29.7% | 4.2% |
| Maximum | 67.3% | 61.3% |
| Range | 37.6% | 57.1% |
| Mean | 51.4% | 32.2% |
| Median | 50.9% | 30.2% |
| Interquartile 25% (IQ1) | 46.1% | 21.3% |
| Interquartile 75% (IQ3) | 58.0% | 43.2% |
| Interquartile Range (IQR) | 11.9% | 21.9% |
| Standard Deviation (Sample) | 9.5% | 14.7% |
| Standard Deviation (Population) | 9.3% | 14.7% |
Similar Demographics by College, 1 year or more
Demographics Similar to Arapaho by College, 1 year or more
In terms of college, 1 year or more, the demographic groups most similar to Arapaho are Immigrants from Jamaica (54.2%, a difference of 0.020%), Cheyenne (54.1%, a difference of 0.060%), Colville (54.1%, a difference of 0.070%), Guyanese (54.1%, a difference of 0.11%), and Ecuadorian (54.3%, a difference of 0.34%).
| Demographics | Rating | Rank | College, 1 year or more |
| Comanche | 0.2 /100 | #272 | Tragic 54.4% |
| Immigrants | Grenada | 0.2 /100 | #273 | Tragic 54.4% |
| Belizeans | 0.2 /100 | #274 | Tragic 54.4% |
| Americans | 0.2 /100 | #275 | Tragic 54.4% |
| Shoshone | 0.2 /100 | #276 | Tragic 54.3% |
| Ecuadorians | 0.2 /100 | #277 | Tragic 54.3% |
| Immigrants | Jamaica | 0.1 /100 | #278 | Tragic 54.2% |
| Arapaho | 0.1 /100 | #279 | Tragic 54.1% |
| Cheyenne | 0.1 /100 | #280 | Tragic 54.1% |
| Colville | 0.1 /100 | #281 | Tragic 54.1% |
| Guyanese | 0.1 /100 | #282 | Tragic 54.1% |
| Nicaraguans | 0.1 /100 | #283 | Tragic 53.9% |
| Ute | 0.1 /100 | #284 | Tragic 53.8% |
| Immigrants | Guyana | 0.1 /100 | #285 | Tragic 53.5% |
| Central American Indians | 0.1 /100 | #286 | Tragic 53.5% |
Demographics Similar to Immigrants from Mexico by College, 1 year or more
In terms of college, 1 year or more, the demographic groups most similar to Immigrants from Mexico are Inupiat (47.2%, a difference of 0.57%), Tohono O'odham (47.1%, a difference of 0.79%), Immigrants from Cabo Verde (48.1%, a difference of 1.2%), Immigrants from the Azores (48.4%, a difference of 1.8%), and Immigrants from Central America (48.5%, a difference of 2.0%).
| Demographics | Rating | Rank | College, 1 year or more |
| Immigrants | Dominican Republic | 0.0 /100 | #333 | Tragic 49.1% |
| Lumbee | 0.0 /100 | #334 | Tragic 48.9% |
| Yuman | 0.0 /100 | #335 | Tragic 48.7% |
| Spanish American Indians | 0.0 /100 | #336 | Tragic 48.5% |
| Pennsylvania Germans | 0.0 /100 | #337 | Tragic 48.5% |
| Immigrants | Central America | 0.0 /100 | #338 | Tragic 48.5% |
| Immigrants | Azores | 0.0 /100 | #339 | Tragic 48.4% |
| Immigrants | Cabo Verde | 0.0 /100 | #340 | Tragic 48.1% |
| Immigrants | Mexico | 0.0 /100 | #341 | Tragic 47.5% |
| Inupiat | 0.0 /100 | #342 | Tragic 47.2% |
| Tohono O'odham | 0.0 /100 | #343 | Tragic 47.1% |
| Yakama | 0.0 /100 | #344 | Tragic 46.2% |
| Pima | 0.0 /100 | #345 | Tragic 45.6% |
| Houma | 0.0 /100 | #346 | Tragic 41.2% |
| Yup'ik | 0.0 /100 | #347 | Tragic 39.4% |