Immigrants from Morocco vs Immigrants from Mexico College, 1 year or more
COMPARE
Immigrants from Morocco
Immigrants from Mexico
College, 1 year or more
College, 1 year or more Comparison
Immigrants from Morocco
Immigrants from Mexico
61.1%
COLLEGE, 1 YEAR OR MORE
89.5/ 100
METRIC RATING
131st/ 347
METRIC RANK
47.5%
COLLEGE, 1 YEAR OR MORE
0.0/ 100
METRIC RATING
341st/ 347
METRIC RANK
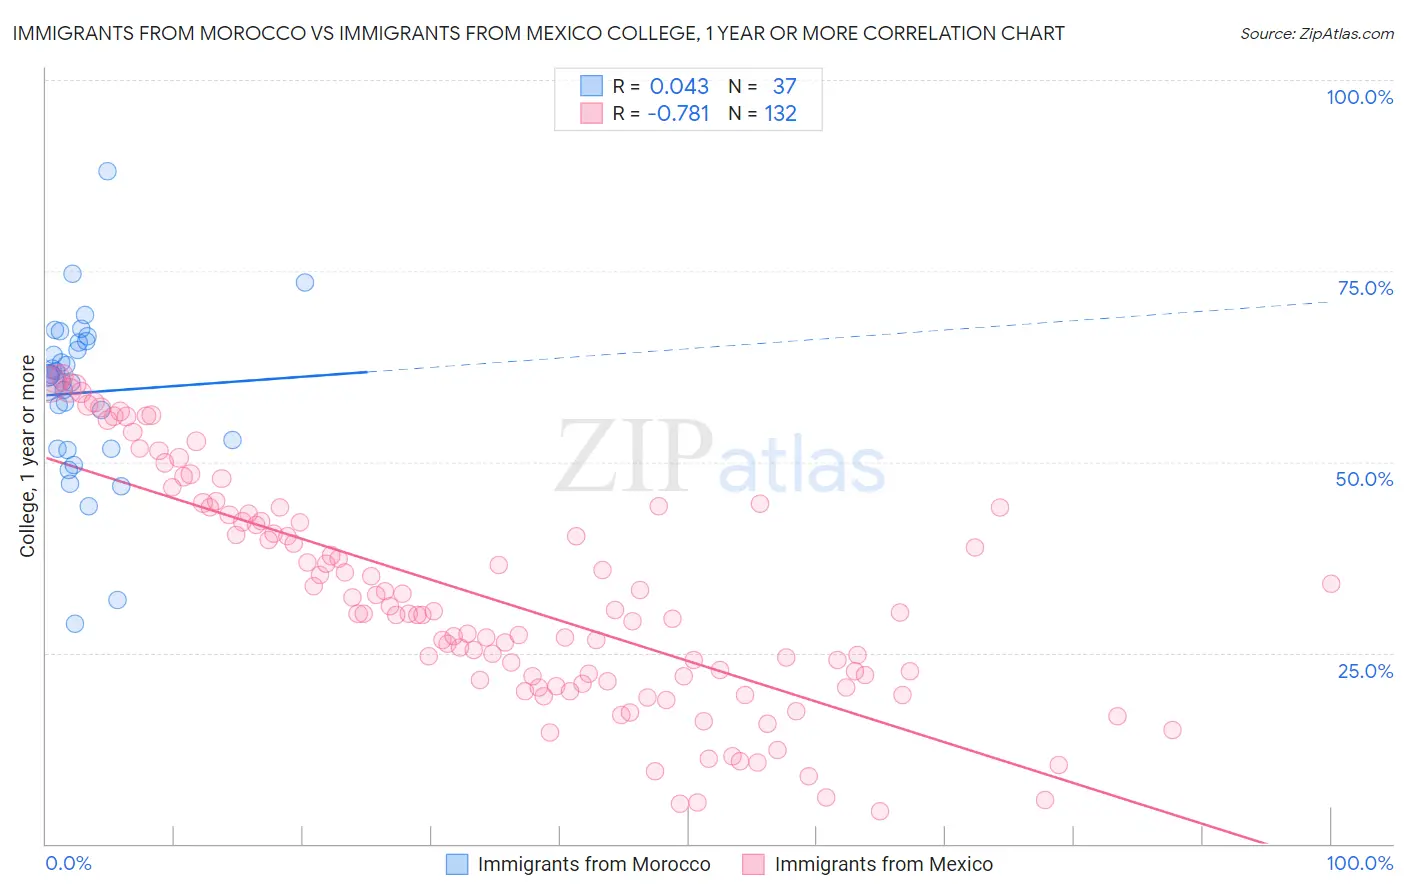
Immigrants from Morocco vs Immigrants from Mexico College, 1 year or more Correlation Chart
The statistical analysis conducted on geographies consisting of 178,912,438 people shows no correlation between the proportion of Immigrants from Morocco and percentage of population with at least college, 1 year or more education in the United States with a correlation coefficient (R) of 0.043 and weighted average of 61.1%. Similarly, the statistical analysis conducted on geographies consisting of 513,754,455 people shows a strong negative correlation between the proportion of Immigrants from Mexico and percentage of population with at least college, 1 year or more education in the United States with a correlation coefficient (R) of -0.781 and weighted average of 47.5%, a difference of 28.6%.
College, 1 year or more Correlation Summary
| Measurement | Immigrants from Morocco | Immigrants from Mexico |
| Minimum | 28.8% | 4.2% |
| Maximum | 88.0% | 61.3% |
| Range | 59.2% | 57.1% |
| Mean | 59.1% | 32.2% |
| Median | 61.2% | 30.2% |
| Interquartile 25% (IQ1) | 51.7% | 21.3% |
| Interquartile 75% (IQ3) | 65.7% | 43.2% |
| Interquartile Range (IQR) | 14.0% | 21.9% |
| Standard Deviation (Sample) | 11.1% | 14.7% |
| Standard Deviation (Population) | 10.9% | 14.7% |
Similar Demographics by College, 1 year or more
Demographics Similar to Immigrants from Morocco by College, 1 year or more
In terms of college, 1 year or more, the demographic groups most similar to Immigrants from Morocco are Italian (61.1%, a difference of 0.0%), Scandinavian (61.0%, a difference of 0.16%), Ugandan (61.2%, a difference of 0.18%), Immigrants from Uzbekistan (61.0%, a difference of 0.19%), and Immigrants from Venezuela (61.0%, a difference of 0.21%).
| Demographics | Rating | Rank | College, 1 year or more |
| Venezuelans | 92.1 /100 | #124 | Exceptional 61.3% |
| Immigrants | Syria | 91.6 /100 | #125 | Exceptional 61.3% |
| Alsatians | 91.3 /100 | #126 | Exceptional 61.3% |
| Immigrants | Eastern Africa | 91.1 /100 | #127 | Exceptional 61.2% |
| Immigrants | Italy | 91.1 /100 | #128 | Exceptional 61.2% |
| Ugandans | 90.7 /100 | #129 | Exceptional 61.2% |
| Italians | 89.5 /100 | #130 | Excellent 61.1% |
| Immigrants | Morocco | 89.5 /100 | #131 | Excellent 61.1% |
| Scandinavians | 88.2 /100 | #132 | Excellent 61.0% |
| Immigrants | Uzbekistan | 88.0 /100 | #133 | Excellent 61.0% |
| Immigrants | Venezuela | 87.9 /100 | #134 | Excellent 61.0% |
| Immigrants | Uganda | 87.4 /100 | #135 | Excellent 60.9% |
| Basques | 87.2 /100 | #136 | Excellent 60.9% |
| Slovenes | 86.5 /100 | #137 | Excellent 60.9% |
| Taiwanese | 84.3 /100 | #138 | Excellent 60.7% |
Demographics Similar to Immigrants from Mexico by College, 1 year or more
In terms of college, 1 year or more, the demographic groups most similar to Immigrants from Mexico are Inupiat (47.2%, a difference of 0.57%), Tohono O'odham (47.1%, a difference of 0.79%), Immigrants from Cabo Verde (48.1%, a difference of 1.2%), Immigrants from the Azores (48.4%, a difference of 1.8%), and Immigrants from Central America (48.5%, a difference of 2.0%).
| Demographics | Rating | Rank | College, 1 year or more |
| Immigrants | Dominican Republic | 0.0 /100 | #333 | Tragic 49.1% |
| Lumbee | 0.0 /100 | #334 | Tragic 48.9% |
| Yuman | 0.0 /100 | #335 | Tragic 48.7% |
| Spanish American Indians | 0.0 /100 | #336 | Tragic 48.5% |
| Pennsylvania Germans | 0.0 /100 | #337 | Tragic 48.5% |
| Immigrants | Central America | 0.0 /100 | #338 | Tragic 48.5% |
| Immigrants | Azores | 0.0 /100 | #339 | Tragic 48.4% |
| Immigrants | Cabo Verde | 0.0 /100 | #340 | Tragic 48.1% |
| Immigrants | Mexico | 0.0 /100 | #341 | Tragic 47.5% |
| Inupiat | 0.0 /100 | #342 | Tragic 47.2% |
| Tohono O'odham | 0.0 /100 | #343 | Tragic 47.1% |
| Yakama | 0.0 /100 | #344 | Tragic 46.2% |
| Pima | 0.0 /100 | #345 | Tragic 45.6% |
| Houma | 0.0 /100 | #346 | Tragic 41.2% |
| Yup'ik | 0.0 /100 | #347 | Tragic 39.4% |