Immigrants from Chile vs Immigrants from Mexico College, 1 year or more
COMPARE
Immigrants from Chile
Immigrants from Mexico
College, 1 year or more
College, 1 year or more Comparison
Immigrants from Chile
Immigrants from Mexico
61.4%
COLLEGE, 1 YEAR OR MORE
92.3/ 100
METRIC RATING
122nd/ 347
METRIC RANK
47.5%
COLLEGE, 1 YEAR OR MORE
0.0/ 100
METRIC RATING
341st/ 347
METRIC RANK
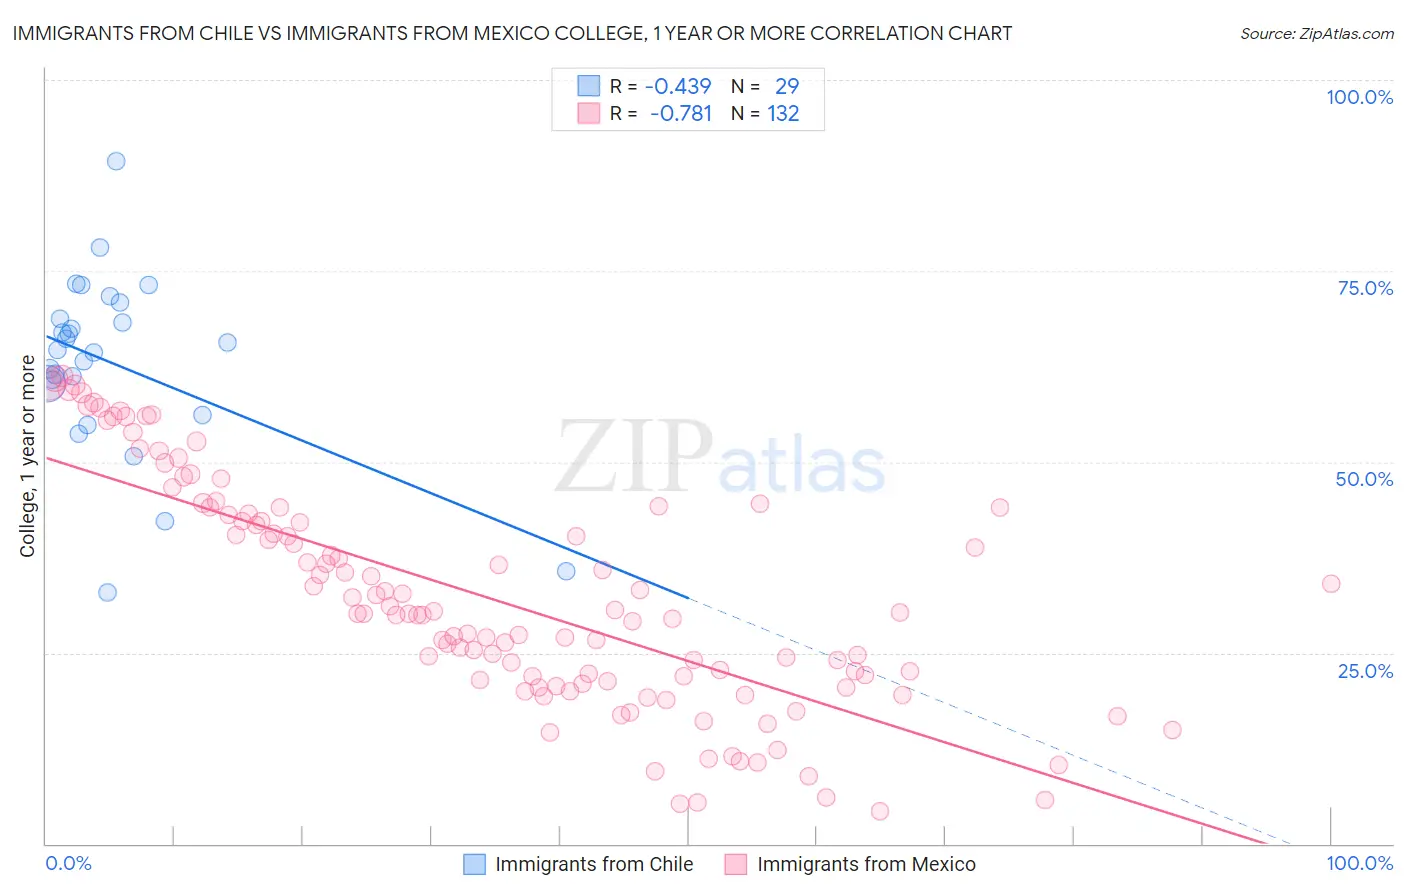
Immigrants from Chile vs Immigrants from Mexico College, 1 year or more Correlation Chart
The statistical analysis conducted on geographies consisting of 218,647,266 people shows a moderate negative correlation between the proportion of Immigrants from Chile and percentage of population with at least college, 1 year or more education in the United States with a correlation coefficient (R) of -0.439 and weighted average of 61.4%. Similarly, the statistical analysis conducted on geographies consisting of 513,754,455 people shows a strong negative correlation between the proportion of Immigrants from Mexico and percentage of population with at least college, 1 year or more education in the United States with a correlation coefficient (R) of -0.781 and weighted average of 47.5%, a difference of 29.2%.
College, 1 year or more Correlation Summary
| Measurement | Immigrants from Chile | Immigrants from Mexico |
| Minimum | 32.9% | 4.2% |
| Maximum | 89.4% | 61.3% |
| Range | 56.5% | 57.1% |
| Mean | 62.9% | 32.2% |
| Median | 64.7% | 30.2% |
| Interquartile 25% (IQ1) | 58.2% | 21.3% |
| Interquartile 75% (IQ3) | 69.8% | 43.2% |
| Interquartile Range (IQR) | 11.7% | 21.9% |
| Standard Deviation (Sample) | 11.9% | 14.7% |
| Standard Deviation (Population) | 11.7% | 14.7% |
Similar Demographics by College, 1 year or more
Demographics Similar to Immigrants from Chile by College, 1 year or more
In terms of college, 1 year or more, the demographic groups most similar to Immigrants from Chile are Serbian (61.4%, a difference of 0.010%), Venezuelan (61.3%, a difference of 0.040%), Immigrants from Jordan (61.4%, a difference of 0.080%), Immigrants from Syria (61.3%, a difference of 0.12%), and Alsatian (61.3%, a difference of 0.16%).
| Demographics | Rating | Rank | College, 1 year or more |
| Norwegians | 94.5 /100 | #115 | Exceptional 61.7% |
| Lebanese | 94.1 /100 | #116 | Exceptional 61.6% |
| Arabs | 93.9 /100 | #117 | Exceptional 61.6% |
| Immigrants | Brazil | 93.9 /100 | #118 | Exceptional 61.6% |
| Assyrians/Chaldeans/Syriacs | 93.3 /100 | #119 | Exceptional 61.5% |
| Pakistanis | 93.2 /100 | #120 | Exceptional 61.5% |
| Immigrants | Jordan | 92.7 /100 | #121 | Exceptional 61.4% |
| Immigrants | Chile | 92.3 /100 | #122 | Exceptional 61.4% |
| Serbians | 92.2 /100 | #123 | Exceptional 61.4% |
| Venezuelans | 92.1 /100 | #124 | Exceptional 61.3% |
| Immigrants | Syria | 91.6 /100 | #125 | Exceptional 61.3% |
| Alsatians | 91.3 /100 | #126 | Exceptional 61.3% |
| Immigrants | Eastern Africa | 91.1 /100 | #127 | Exceptional 61.2% |
| Immigrants | Italy | 91.1 /100 | #128 | Exceptional 61.2% |
| Ugandans | 90.7 /100 | #129 | Exceptional 61.2% |
Demographics Similar to Immigrants from Mexico by College, 1 year or more
In terms of college, 1 year or more, the demographic groups most similar to Immigrants from Mexico are Inupiat (47.2%, a difference of 0.57%), Tohono O'odham (47.1%, a difference of 0.79%), Immigrants from Cabo Verde (48.1%, a difference of 1.2%), Immigrants from the Azores (48.4%, a difference of 1.8%), and Immigrants from Central America (48.5%, a difference of 2.0%).
| Demographics | Rating | Rank | College, 1 year or more |
| Immigrants | Dominican Republic | 0.0 /100 | #333 | Tragic 49.1% |
| Lumbee | 0.0 /100 | #334 | Tragic 48.9% |
| Yuman | 0.0 /100 | #335 | Tragic 48.7% |
| Spanish American Indians | 0.0 /100 | #336 | Tragic 48.5% |
| Pennsylvania Germans | 0.0 /100 | #337 | Tragic 48.5% |
| Immigrants | Central America | 0.0 /100 | #338 | Tragic 48.5% |
| Immigrants | Azores | 0.0 /100 | #339 | Tragic 48.4% |
| Immigrants | Cabo Verde | 0.0 /100 | #340 | Tragic 48.1% |
| Immigrants | Mexico | 0.0 /100 | #341 | Tragic 47.5% |
| Inupiat | 0.0 /100 | #342 | Tragic 47.2% |
| Tohono O'odham | 0.0 /100 | #343 | Tragic 47.1% |
| Yakama | 0.0 /100 | #344 | Tragic 46.2% |
| Pima | 0.0 /100 | #345 | Tragic 45.6% |
| Houma | 0.0 /100 | #346 | Tragic 41.2% |
| Yup'ik | 0.0 /100 | #347 | Tragic 39.4% |