Central American Indian vs Basque College, 1 year or more
COMPARE
Central American Indian
Basque
College, 1 year or more
College, 1 year or more Comparison
Central American Indians
Basques
53.5%
COLLEGE, 1 YEAR OR MORE
0.1/ 100
METRIC RATING
286th/ 347
METRIC RANK
60.9%
COLLEGE, 1 YEAR OR MORE
87.2/ 100
METRIC RATING
136th/ 347
METRIC RANK
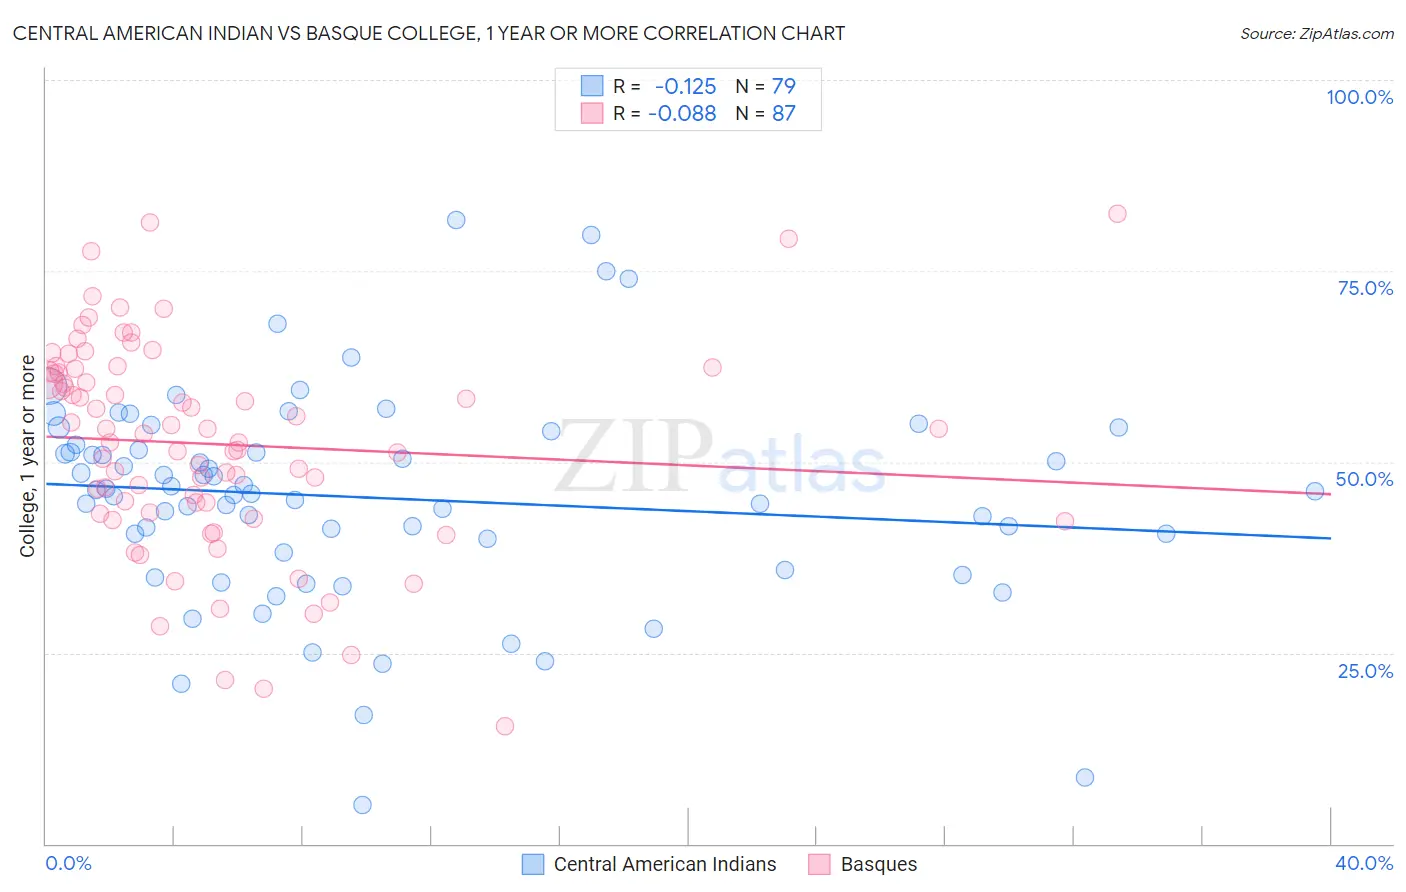
Central American Indian vs Basque College, 1 year or more Correlation Chart
The statistical analysis conducted on geographies consisting of 326,142,624 people shows a poor negative correlation between the proportion of Central American Indians and percentage of population with at least college, 1 year or more education in the United States with a correlation coefficient (R) of -0.125 and weighted average of 53.5%. Similarly, the statistical analysis conducted on geographies consisting of 165,778,610 people shows a slight negative correlation between the proportion of Basques and percentage of population with at least college, 1 year or more education in the United States with a correlation coefficient (R) of -0.088 and weighted average of 60.9%, a difference of 13.8%.
College, 1 year or more Correlation Summary
| Measurement | Central American Indian | Basque |
| Minimum | 5.1% | 15.4% |
| Maximum | 81.6% | 82.5% |
| Range | 76.5% | 67.1% |
| Mean | 45.3% | 52.3% |
| Median | 46.2% | 53.6% |
| Interquartile 25% (IQ1) | 38.2% | 43.4% |
| Interquartile 75% (IQ3) | 52.2% | 61.8% |
| Interquartile Range (IQR) | 14.0% | 18.4% |
| Standard Deviation (Sample) | 13.9% | 13.7% |
| Standard Deviation (Population) | 13.9% | 13.7% |
Similar Demographics by College, 1 year or more
Demographics Similar to Central American Indians by College, 1 year or more
In terms of college, 1 year or more, the demographic groups most similar to Central American Indians are Immigrants from Belize (53.5%, a difference of 0.030%), Immigrants from Guyana (53.5%, a difference of 0.040%), Alaska Native (53.4%, a difference of 0.20%), Immigrants from Ecuador (53.4%, a difference of 0.21%), and Alaskan Athabascan (53.4%, a difference of 0.22%).
| Demographics | Rating | Rank | College, 1 year or more |
| Arapaho | 0.1 /100 | #279 | Tragic 54.1% |
| Cheyenne | 0.1 /100 | #280 | Tragic 54.1% |
| Colville | 0.1 /100 | #281 | Tragic 54.1% |
| Guyanese | 0.1 /100 | #282 | Tragic 54.1% |
| Nicaraguans | 0.1 /100 | #283 | Tragic 53.9% |
| Ute | 0.1 /100 | #284 | Tragic 53.8% |
| Immigrants | Guyana | 0.1 /100 | #285 | Tragic 53.5% |
| Central American Indians | 0.1 /100 | #286 | Tragic 53.5% |
| Immigrants | Belize | 0.1 /100 | #287 | Tragic 53.5% |
| Alaska Natives | 0.0 /100 | #288 | Tragic 53.4% |
| Immigrants | Ecuador | 0.0 /100 | #289 | Tragic 53.4% |
| Alaskan Athabascans | 0.0 /100 | #290 | Tragic 53.4% |
| Cubans | 0.0 /100 | #291 | Tragic 53.4% |
| Chickasaw | 0.0 /100 | #292 | Tragic 53.3% |
| Blacks/African Americans | 0.0 /100 | #293 | Tragic 53.3% |
Demographics Similar to Basques by College, 1 year or more
In terms of college, 1 year or more, the demographic groups most similar to Basques are Immigrants from Uganda (60.9%, a difference of 0.020%), Immigrants from Venezuela (61.0%, a difference of 0.080%), Immigrants from Uzbekistan (61.0%, a difference of 0.090%), Slovene (60.9%, a difference of 0.090%), and Scandinavian (61.0%, a difference of 0.12%).
| Demographics | Rating | Rank | College, 1 year or more |
| Ugandans | 90.7 /100 | #129 | Exceptional 61.2% |
| Italians | 89.5 /100 | #130 | Excellent 61.1% |
| Immigrants | Morocco | 89.5 /100 | #131 | Excellent 61.1% |
| Scandinavians | 88.2 /100 | #132 | Excellent 61.0% |
| Immigrants | Uzbekistan | 88.0 /100 | #133 | Excellent 61.0% |
| Immigrants | Venezuela | 87.9 /100 | #134 | Excellent 61.0% |
| Immigrants | Uganda | 87.4 /100 | #135 | Excellent 60.9% |
| Basques | 87.2 /100 | #136 | Excellent 60.9% |
| Slovenes | 86.5 /100 | #137 | Excellent 60.9% |
| Taiwanese | 84.3 /100 | #138 | Excellent 60.7% |
| Immigrants | Eritrea | 84.3 /100 | #139 | Excellent 60.7% |
| Iraqis | 83.3 /100 | #140 | Excellent 60.7% |
| Immigrants | Afghanistan | 83.1 /100 | #141 | Excellent 60.7% |
| Poles | 82.8 /100 | #142 | Excellent 60.7% |
| Canadians | 82.7 /100 | #143 | Excellent 60.6% |