Slovene vs Swiss GED/Equivalency
COMPARE
Slovene
Swiss
GED/Equivalency
GED/Equivalency Comparison
Slovenes
Swiss
88.8%
GED/EQUIVALENCY
99.9/ 100
METRIC RATING
18th/ 347
METRIC RANK
87.0%
GED/EQUIVALENCY
94.5/ 100
METRIC RATING
116th/ 347
METRIC RANK
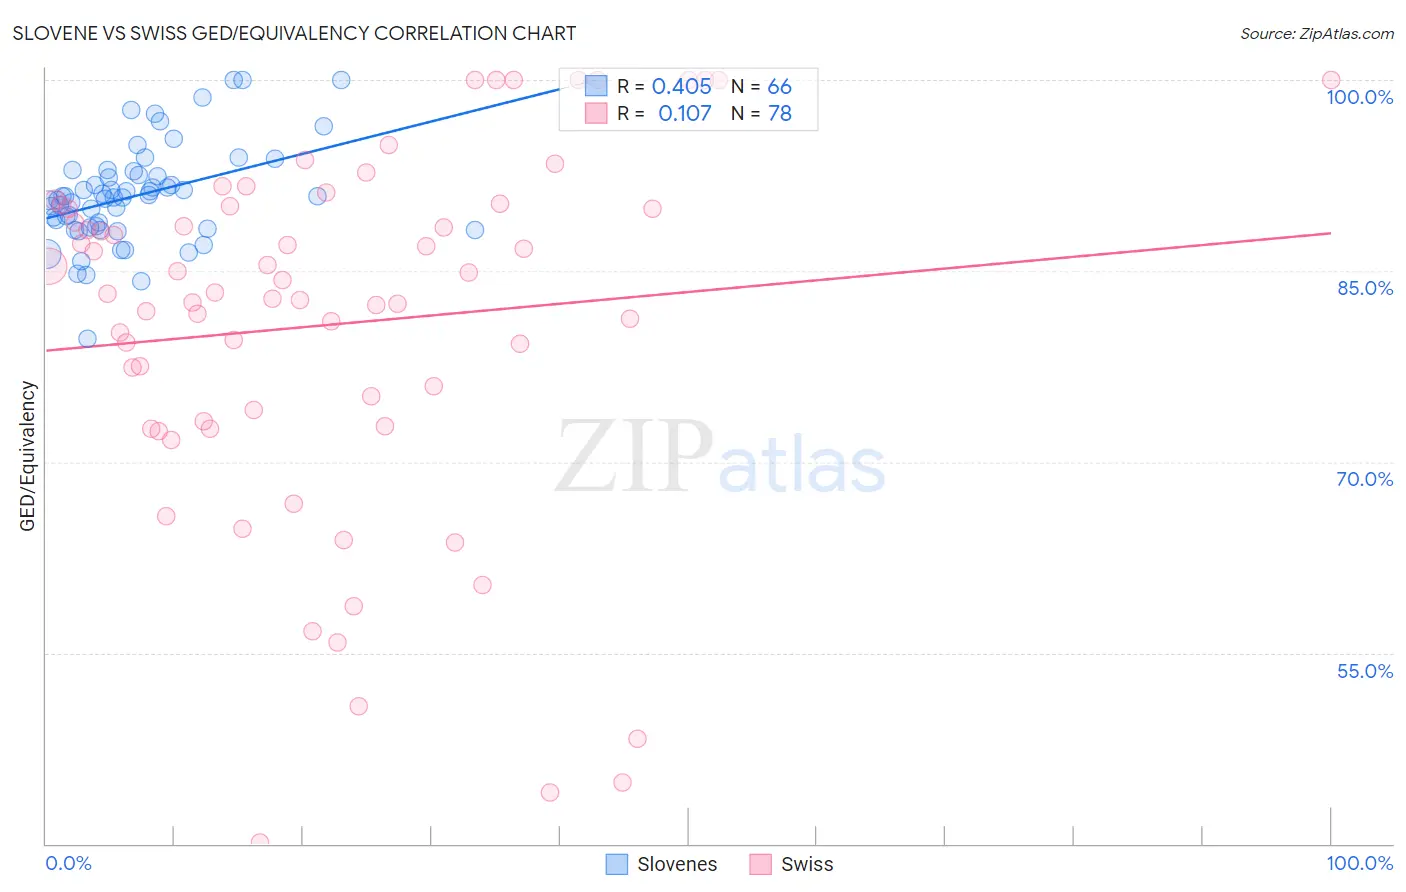
Slovene vs Swiss GED/Equivalency Correlation Chart
The statistical analysis conducted on geographies consisting of 261,353,399 people shows a moderate positive correlation between the proportion of Slovenes and percentage of population with at least ged/equivalency education in the United States with a correlation coefficient (R) of 0.405 and weighted average of 88.8%. Similarly, the statistical analysis conducted on geographies consisting of 465,022,572 people shows a poor positive correlation between the proportion of Swiss and percentage of population with at least ged/equivalency education in the United States with a correlation coefficient (R) of 0.107 and weighted average of 87.0%, a difference of 2.1%.
GED/Equivalency Correlation Summary
| Measurement | Slovene | Swiss |
| Minimum | 79.6% | 40.1% |
| Maximum | 100.0% | 100.0% |
| Range | 20.4% | 59.9% |
| Mean | 90.9% | 80.8% |
| Median | 90.8% | 83.3% |
| Interquartile 25% (IQ1) | 88.4% | 73.2% |
| Interquartile 75% (IQ3) | 92.5% | 90.1% |
| Interquartile Range (IQR) | 4.1% | 16.9% |
| Standard Deviation (Sample) | 3.9% | 14.3% |
| Standard Deviation (Population) | 3.9% | 14.2% |
Similar Demographics by GED/Equivalency
Demographics Similar to Slovenes by GED/Equivalency
In terms of ged/equivalency, the demographic groups most similar to Slovenes are Croatian (88.8%, a difference of 0.030%), Swedish (88.8%, a difference of 0.050%), Immigrants from Taiwan (88.8%, a difference of 0.060%), Okinawan (88.9%, a difference of 0.090%), and Cypriot (88.9%, a difference of 0.11%).
| Demographics | Rating | Rank | GED/Equivalency |
| Bulgarians | 99.9 /100 | #11 | Exceptional 89.0% |
| Lithuanians | 99.9 /100 | #12 | Exceptional 88.9% |
| Immigrants | Iran | 99.9 /100 | #13 | Exceptional 88.9% |
| Cypriots | 99.9 /100 | #14 | Exceptional 88.9% |
| Okinawans | 99.9 /100 | #15 | Exceptional 88.9% |
| Immigrants | Taiwan | 99.9 /100 | #16 | Exceptional 88.8% |
| Croatians | 99.9 /100 | #17 | Exceptional 88.8% |
| Slovenes | 99.9 /100 | #18 | Exceptional 88.8% |
| Swedes | 99.9 /100 | #19 | Exceptional 88.8% |
| Maltese | 99.9 /100 | #20 | Exceptional 88.6% |
| Luxembourgers | 99.8 /100 | #21 | Exceptional 88.6% |
| Immigrants | Ireland | 99.8 /100 | #22 | Exceptional 88.6% |
| Russians | 99.8 /100 | #23 | Exceptional 88.6% |
| Slovaks | 99.8 /100 | #24 | Exceptional 88.6% |
| Estonians | 99.8 /100 | #25 | Exceptional 88.6% |
Demographics Similar to Swiss by GED/Equivalency
In terms of ged/equivalency, the demographic groups most similar to Swiss are Mongolian (87.0%, a difference of 0.010%), Immigrants from Kazakhstan (87.0%, a difference of 0.020%), Tlingit-Haida (87.0%, a difference of 0.030%), Assyrian/Chaldean/Syriac (87.0%, a difference of 0.030%), and French (87.1%, a difference of 0.070%).
| Demographics | Rating | Rank | GED/Equivalency |
| Immigrants | Eastern Europe | 95.5 /100 | #109 | Exceptional 87.1% |
| Egyptians | 95.3 /100 | #110 | Exceptional 87.1% |
| French | 95.2 /100 | #111 | Exceptional 87.1% |
| Tlingit-Haida | 94.8 /100 | #112 | Exceptional 87.0% |
| Assyrians/Chaldeans/Syriacs | 94.8 /100 | #113 | Exceptional 87.0% |
| Immigrants | Kazakhstan | 94.7 /100 | #114 | Exceptional 87.0% |
| Mongolians | 94.6 /100 | #115 | Exceptional 87.0% |
| Swiss | 94.5 /100 | #116 | Exceptional 87.0% |
| Immigrants | Hong Kong | 93.8 /100 | #117 | Exceptional 86.9% |
| French Canadians | 93.2 /100 | #118 | Exceptional 86.9% |
| Immigrants | China | 93.2 /100 | #119 | Exceptional 86.9% |
| Scotch-Irish | 91.6 /100 | #120 | Exceptional 86.8% |
| Immigrants | Lebanon | 90.9 /100 | #121 | Exceptional 86.8% |
| Immigrants | Jordan | 90.8 /100 | #122 | Exceptional 86.8% |
| Immigrants | Italy | 90.5 /100 | #123 | Exceptional 86.7% |