Thai vs Immigrants from Oceania College, 1 year or more
COMPARE
Thai
Immigrants from Oceania
College, 1 year or more
College, 1 year or more Comparison
Thais
Immigrants from Oceania
68.6%
COLLEGE, 1 YEAR OR MORE
100.0/ 100
METRIC RATING
8th/ 347
METRIC RANK
59.4%
COLLEGE, 1 YEAR OR MORE
51.2/ 100
METRIC RATING
173rd/ 347
METRIC RANK
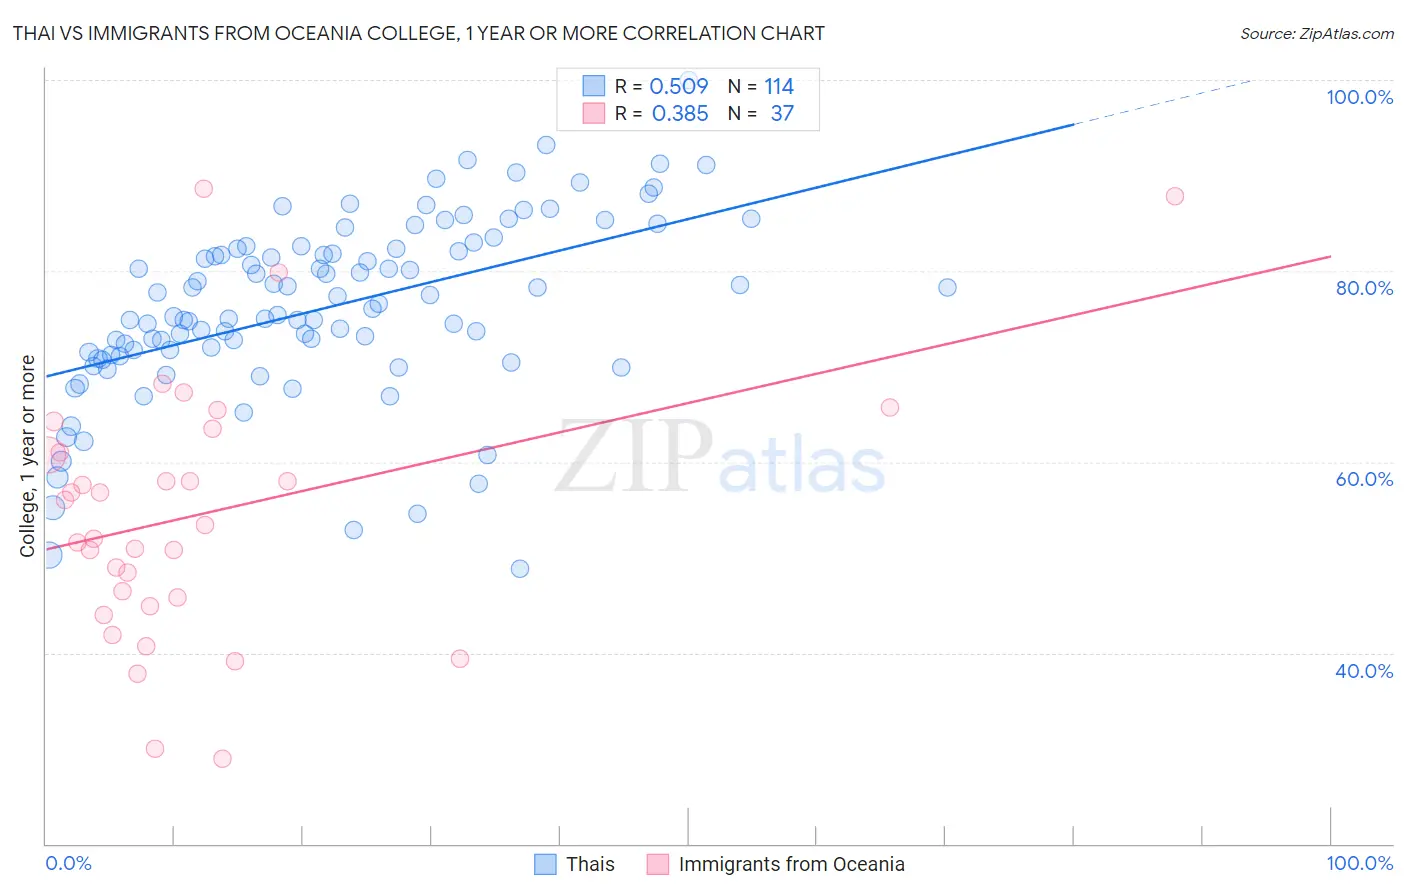
Thai vs Immigrants from Oceania College, 1 year or more Correlation Chart
The statistical analysis conducted on geographies consisting of 475,810,448 people shows a substantial positive correlation between the proportion of Thais and percentage of population with at least college, 1 year or more education in the United States with a correlation coefficient (R) of 0.509 and weighted average of 68.6%. Similarly, the statistical analysis conducted on geographies consisting of 305,519,500 people shows a mild positive correlation between the proportion of Immigrants from Oceania and percentage of population with at least college, 1 year or more education in the United States with a correlation coefficient (R) of 0.385 and weighted average of 59.4%, a difference of 15.4%.
College, 1 year or more Correlation Summary
| Measurement | Thai | Immigrants from Oceania |
| Minimum | 48.8% | 28.9% |
| Maximum | 100.0% | 88.6% |
| Range | 51.2% | 59.6% |
| Mean | 76.1% | 54.6% |
| Median | 75.8% | 53.4% |
| Interquartile 25% (IQ1) | 71.2% | 45.3% |
| Interquartile 75% (IQ3) | 82.3% | 62.3% |
| Interquartile Range (IQR) | 11.0% | 16.9% |
| Standard Deviation (Sample) | 9.4% | 13.6% |
| Standard Deviation (Population) | 9.3% | 13.4% |
Similar Demographics by College, 1 year or more
Demographics Similar to Thais by College, 1 year or more
In terms of college, 1 year or more, the demographic groups most similar to Thais are Okinawan (69.0%, a difference of 0.54%), Immigrants from Israel (67.8%, a difference of 1.2%), Immigrants from Iran (69.5%, a difference of 1.3%), Immigrants from Australia (67.7%, a difference of 1.4%), and Immigrants from Taiwan (69.6%, a difference of 1.5%).
| Demographics | Rating | Rank | College, 1 year or more |
| Filipinos | 100.0 /100 | #1 | Exceptional 71.0% |
| Immigrants | Singapore | 100.0 /100 | #2 | Exceptional 70.1% |
| Iranians | 100.0 /100 | #3 | Exceptional 70.0% |
| Immigrants | Taiwan | 100.0 /100 | #4 | Exceptional 69.6% |
| Immigrants | India | 100.0 /100 | #5 | Exceptional 69.6% |
| Immigrants | Iran | 100.0 /100 | #6 | Exceptional 69.5% |
| Okinawans | 100.0 /100 | #7 | Exceptional 69.0% |
| Thais | 100.0 /100 | #8 | Exceptional 68.6% |
| Immigrants | Israel | 100.0 /100 | #9 | Exceptional 67.8% |
| Immigrants | Australia | 100.0 /100 | #10 | Exceptional 67.7% |
| Immigrants | South Central Asia | 100.0 /100 | #11 | Exceptional 67.1% |
| Cypriots | 100.0 /100 | #12 | Exceptional 67.0% |
| Immigrants | Sweden | 100.0 /100 | #13 | Exceptional 66.8% |
| Burmese | 100.0 /100 | #14 | Exceptional 66.7% |
| Cambodians | 100.0 /100 | #15 | Exceptional 66.7% |
Demographics Similar to Immigrants from Oceania by College, 1 year or more
In terms of college, 1 year or more, the demographic groups most similar to Immigrants from Oceania are Immigrants from Sierra Leone (59.5%, a difference of 0.050%), Welsh (59.5%, a difference of 0.060%), Immigrants from Albania (59.5%, a difference of 0.060%), Celtic (59.4%, a difference of 0.060%), and Immigrants from Southern Europe (59.5%, a difference of 0.080%).
| Demographics | Rating | Rank | College, 1 year or more |
| Immigrants | Africa | 56.1 /100 | #166 | Average 59.6% |
| Immigrants | North Macedonia | 53.1 /100 | #167 | Average 59.5% |
| Hungarians | 52.9 /100 | #168 | Average 59.5% |
| Immigrants | Southern Europe | 52.7 /100 | #169 | Average 59.5% |
| Welsh | 52.4 /100 | #170 | Average 59.5% |
| Immigrants | Albania | 52.3 /100 | #171 | Average 59.5% |
| Immigrants | Sierra Leone | 52.2 /100 | #172 | Average 59.5% |
| Immigrants | Oceania | 51.2 /100 | #173 | Average 59.4% |
| Celtics | 50.0 /100 | #174 | Average 59.4% |
| Sri Lankans | 49.0 /100 | #175 | Average 59.4% |
| Immigrants | Poland | 48.9 /100 | #176 | Average 59.4% |
| Tlingit-Haida | 48.4 /100 | #177 | Average 59.4% |
| Czechoslovakians | 48.3 /100 | #178 | Average 59.4% |
| Bermudans | 46.6 /100 | #179 | Average 59.3% |
| Yugoslavians | 44.1 /100 | #180 | Average 59.2% |