Immigrants from Portugal vs Immigrants from Oceania College, 1 year or more
COMPARE
Immigrants from Portugal
Immigrants from Oceania
College, 1 year or more
College, 1 year or more Comparison
Immigrants from Portugal
Immigrants from Oceania
51.9%
COLLEGE, 1 YEAR OR MORE
0.0/ 100
METRIC RATING
307th/ 347
METRIC RANK
59.4%
COLLEGE, 1 YEAR OR MORE
51.2/ 100
METRIC RATING
173rd/ 347
METRIC RANK
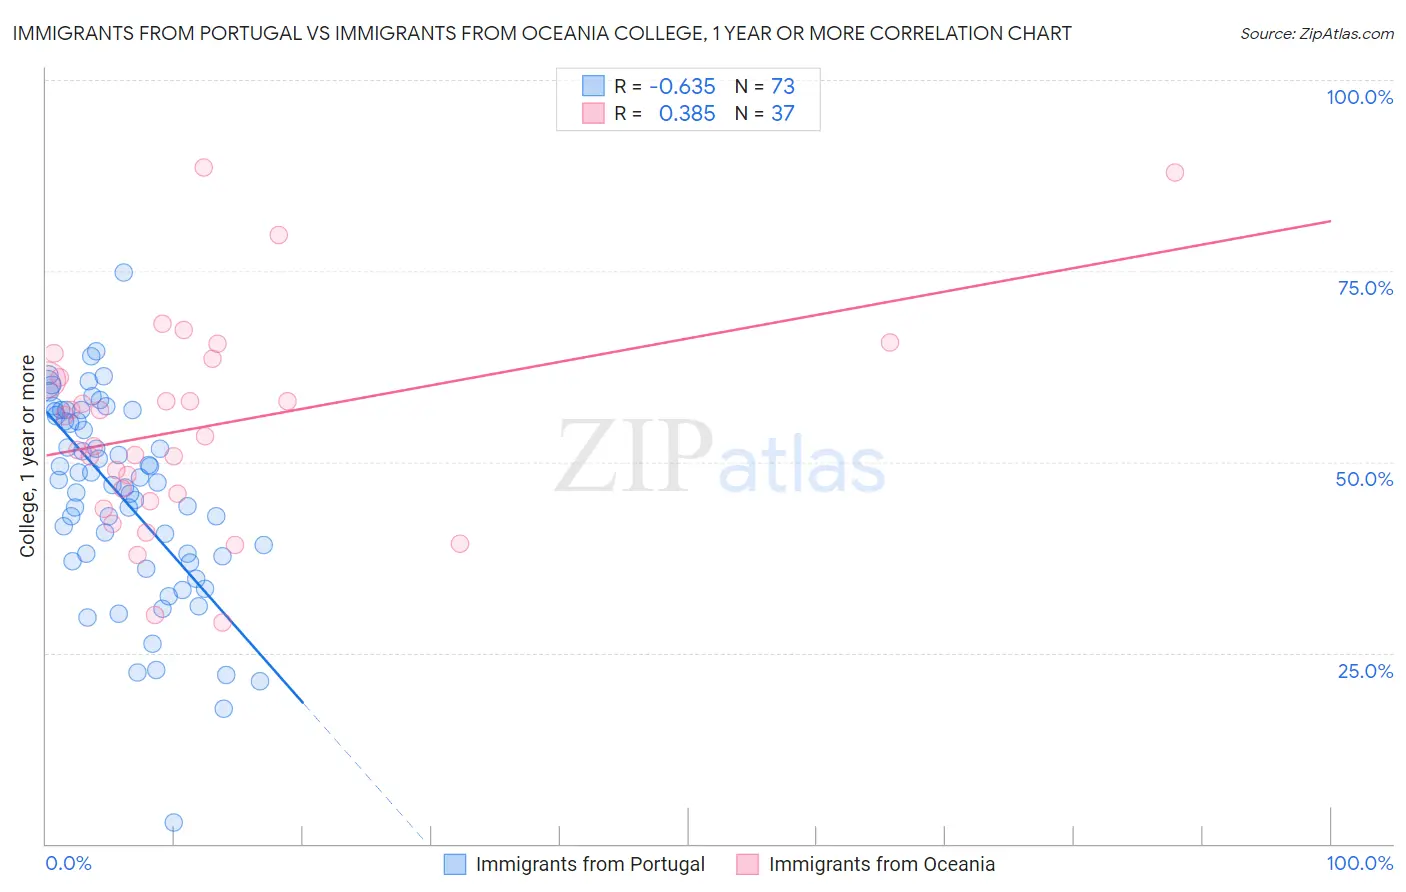
Immigrants from Portugal vs Immigrants from Oceania College, 1 year or more Correlation Chart
The statistical analysis conducted on geographies consisting of 174,792,609 people shows a significant negative correlation between the proportion of Immigrants from Portugal and percentage of population with at least college, 1 year or more education in the United States with a correlation coefficient (R) of -0.635 and weighted average of 51.9%. Similarly, the statistical analysis conducted on geographies consisting of 305,519,500 people shows a mild positive correlation between the proportion of Immigrants from Oceania and percentage of population with at least college, 1 year or more education in the United States with a correlation coefficient (R) of 0.385 and weighted average of 59.4%, a difference of 14.6%.
College, 1 year or more Correlation Summary
| Measurement | Immigrants from Portugal | Immigrants from Oceania |
| Minimum | 2.8% | 28.9% |
| Maximum | 74.9% | 88.6% |
| Range | 72.1% | 59.6% |
| Mean | 45.5% | 54.6% |
| Median | 47.3% | 53.4% |
| Interquartile 25% (IQ1) | 37.3% | 45.3% |
| Interquartile 75% (IQ3) | 56.3% | 62.3% |
| Interquartile Range (IQR) | 19.0% | 16.9% |
| Standard Deviation (Sample) | 13.0% | 13.6% |
| Standard Deviation (Population) | 12.9% | 13.4% |
Similar Demographics by College, 1 year or more
Demographics Similar to Immigrants from Portugal by College, 1 year or more
In terms of college, 1 year or more, the demographic groups most similar to Immigrants from Portugal are Mexican American Indian (51.9%, a difference of 0.10%), Salvadoran (51.8%, a difference of 0.10%), Apache (51.8%, a difference of 0.11%), Seminole (52.1%, a difference of 0.44%), and Honduran (51.6%, a difference of 0.50%).
| Demographics | Rating | Rank | College, 1 year or more |
| Choctaw | 0.0 /100 | #300 | Tragic 52.3% |
| Haitians | 0.0 /100 | #301 | Tragic 52.3% |
| Puerto Ricans | 0.0 /100 | #302 | Tragic 52.2% |
| Creek | 0.0 /100 | #303 | Tragic 52.2% |
| Central Americans | 0.0 /100 | #304 | Tragic 52.1% |
| Seminole | 0.0 /100 | #305 | Tragic 52.1% |
| Mexican American Indians | 0.0 /100 | #306 | Tragic 51.9% |
| Immigrants | Portugal | 0.0 /100 | #307 | Tragic 51.9% |
| Salvadorans | 0.0 /100 | #308 | Tragic 51.8% |
| Apache | 0.0 /100 | #309 | Tragic 51.8% |
| Hondurans | 0.0 /100 | #310 | Tragic 51.6% |
| Immigrants | Haiti | 0.0 /100 | #311 | Tragic 51.5% |
| Pueblo | 0.0 /100 | #312 | Tragic 51.5% |
| Immigrants | Caribbean | 0.0 /100 | #313 | Tragic 51.4% |
| Fijians | 0.0 /100 | #314 | Tragic 51.3% |
Demographics Similar to Immigrants from Oceania by College, 1 year or more
In terms of college, 1 year or more, the demographic groups most similar to Immigrants from Oceania are Immigrants from Sierra Leone (59.5%, a difference of 0.050%), Welsh (59.5%, a difference of 0.060%), Immigrants from Albania (59.5%, a difference of 0.060%), Celtic (59.4%, a difference of 0.060%), and Immigrants from Southern Europe (59.5%, a difference of 0.080%).
| Demographics | Rating | Rank | College, 1 year or more |
| Immigrants | Africa | 56.1 /100 | #166 | Average 59.6% |
| Immigrants | North Macedonia | 53.1 /100 | #167 | Average 59.5% |
| Hungarians | 52.9 /100 | #168 | Average 59.5% |
| Immigrants | Southern Europe | 52.7 /100 | #169 | Average 59.5% |
| Welsh | 52.4 /100 | #170 | Average 59.5% |
| Immigrants | Albania | 52.3 /100 | #171 | Average 59.5% |
| Immigrants | Sierra Leone | 52.2 /100 | #172 | Average 59.5% |
| Immigrants | Oceania | 51.2 /100 | #173 | Average 59.4% |
| Celtics | 50.0 /100 | #174 | Average 59.4% |
| Sri Lankans | 49.0 /100 | #175 | Average 59.4% |
| Immigrants | Poland | 48.9 /100 | #176 | Average 59.4% |
| Tlingit-Haida | 48.4 /100 | #177 | Average 59.4% |
| Czechoslovakians | 48.3 /100 | #178 | Average 59.4% |
| Bermudans | 46.6 /100 | #179 | Average 59.3% |
| Yugoslavians | 44.1 /100 | #180 | Average 59.2% |