Immigrants from Poland vs Immigrants from Germany College, 1 year or more
COMPARE
Immigrants from Poland
Immigrants from Germany
College, 1 year or more
College, 1 year or more Comparison
Immigrants from Poland
Immigrants from Germany
59.4%
COLLEGE, 1 YEAR OR MORE
48.9/ 100
METRIC RATING
176th/ 347
METRIC RANK
60.3%
COLLEGE, 1 YEAR OR MORE
76.1/ 100
METRIC RATING
152nd/ 347
METRIC RANK
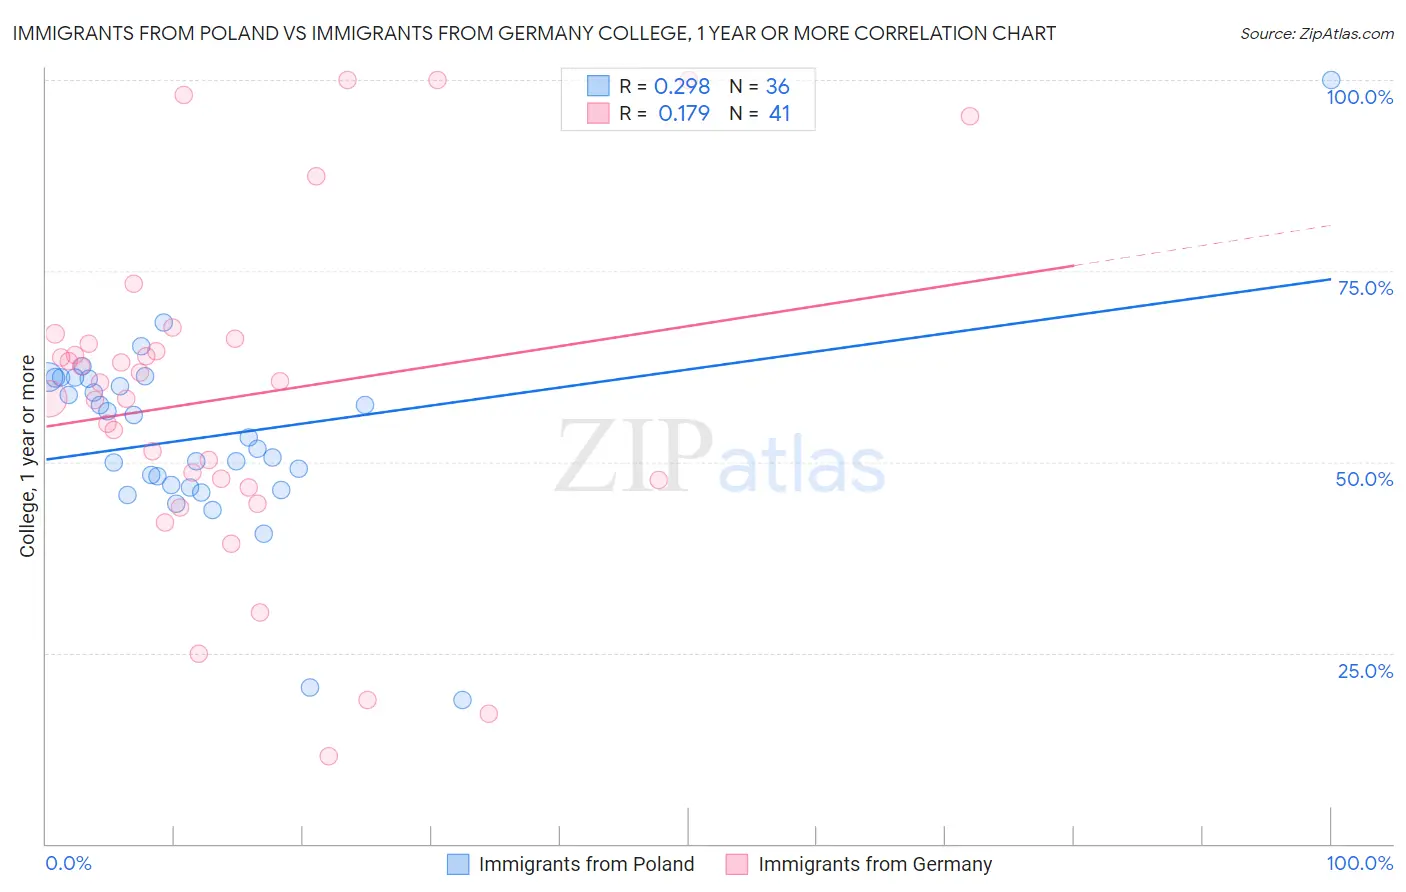
Immigrants from Poland vs Immigrants from Germany College, 1 year or more Correlation Chart
The statistical analysis conducted on geographies consisting of 304,861,916 people shows a weak positive correlation between the proportion of Immigrants from Poland and percentage of population with at least college, 1 year or more education in the United States with a correlation coefficient (R) of 0.298 and weighted average of 59.4%. Similarly, the statistical analysis conducted on geographies consisting of 463,883,930 people shows a poor positive correlation between the proportion of Immigrants from Germany and percentage of population with at least college, 1 year or more education in the United States with a correlation coefficient (R) of 0.179 and weighted average of 60.3%, a difference of 1.6%.
College, 1 year or more Correlation Summary
| Measurement | Immigrants from Poland | Immigrants from Germany |
| Minimum | 18.8% | 11.4% |
| Maximum | 100.0% | 100.0% |
| Range | 81.2% | 88.6% |
| Mean | 53.3% | 58.4% |
| Median | 52.5% | 60.4% |
| Interquartile 25% (IQ1) | 46.8% | 47.2% |
| Interquartile 75% (IQ3) | 60.9% | 65.8% |
| Interquartile Range (IQR) | 14.1% | 18.6% |
| Standard Deviation (Sample) | 13.2% | 21.6% |
| Standard Deviation (Population) | 13.0% | 21.4% |
Similar Demographics by College, 1 year or more
Demographics Similar to Immigrants from Poland by College, 1 year or more
In terms of college, 1 year or more, the demographic groups most similar to Immigrants from Poland are Sri Lankan (59.4%, a difference of 0.010%), Tlingit-Haida (59.4%, a difference of 0.030%), Czechoslovakian (59.4%, a difference of 0.030%), Celtic (59.4%, a difference of 0.060%), and Immigrants from Oceania (59.4%, a difference of 0.12%).
| Demographics | Rating | Rank | College, 1 year or more |
| Immigrants | Southern Europe | 52.7 /100 | #169 | Average 59.5% |
| Welsh | 52.4 /100 | #170 | Average 59.5% |
| Immigrants | Albania | 52.3 /100 | #171 | Average 59.5% |
| Immigrants | Sierra Leone | 52.2 /100 | #172 | Average 59.5% |
| Immigrants | Oceania | 51.2 /100 | #173 | Average 59.4% |
| Celtics | 50.0 /100 | #174 | Average 59.4% |
| Sri Lankans | 49.0 /100 | #175 | Average 59.4% |
| Immigrants | Poland | 48.9 /100 | #176 | Average 59.4% |
| Tlingit-Haida | 48.4 /100 | #177 | Average 59.4% |
| Czechoslovakians | 48.3 /100 | #178 | Average 59.4% |
| Bermudans | 46.6 /100 | #179 | Average 59.3% |
| Yugoslavians | 44.1 /100 | #180 | Average 59.2% |
| Swiss | 43.4 /100 | #181 | Average 59.2% |
| Immigrants | Bosnia and Herzegovina | 42.8 /100 | #182 | Average 59.2% |
| German Russians | 39.3 /100 | #183 | Fair 59.1% |
Demographics Similar to Immigrants from Germany by College, 1 year or more
In terms of college, 1 year or more, the demographic groups most similar to Immigrants from Germany are Immigrants from Sudan (60.4%, a difference of 0.13%), Albanian (60.4%, a difference of 0.13%), Sierra Leonean (60.2%, a difference of 0.14%), Kenyan (60.5%, a difference of 0.22%), and Brazilian (60.5%, a difference of 0.22%).
| Demographics | Rating | Rank | College, 1 year or more |
| Slavs | 81.1 /100 | #145 | Excellent 60.6% |
| Scottish | 80.2 /100 | #146 | Excellent 60.5% |
| Immigrants | Kenya | 79.1 /100 | #147 | Good 60.5% |
| Kenyans | 79.0 /100 | #148 | Good 60.5% |
| Brazilians | 79.0 /100 | #149 | Good 60.5% |
| Immigrants | Sudan | 77.8 /100 | #150 | Good 60.4% |
| Albanians | 77.8 /100 | #151 | Good 60.4% |
| Immigrants | Germany | 76.1 /100 | #152 | Good 60.3% |
| Sierra Leoneans | 74.1 /100 | #153 | Good 60.2% |
| Sudanese | 73.0 /100 | #154 | Good 60.2% |
| Moroccans | 72.9 /100 | #155 | Good 60.2% |
| Finns | 72.9 /100 | #156 | Good 60.2% |
| Immigrants | Armenia | 68.8 /100 | #157 | Good 60.0% |
| English | 67.2 /100 | #158 | Good 60.0% |
| Immigrants | Iraq | 67.0 /100 | #159 | Good 60.0% |