Immigrants from Ireland vs Immigrants from Germany College, 1 year or more
COMPARE
Immigrants from Ireland
Immigrants from Germany
College, 1 year or more
College, 1 year or more Comparison
Immigrants from Ireland
Immigrants from Germany
65.9%
COLLEGE, 1 YEAR OR MORE
100.0/ 100
METRIC RATING
27th/ 347
METRIC RANK
60.3%
COLLEGE, 1 YEAR OR MORE
76.1/ 100
METRIC RATING
152nd/ 347
METRIC RANK
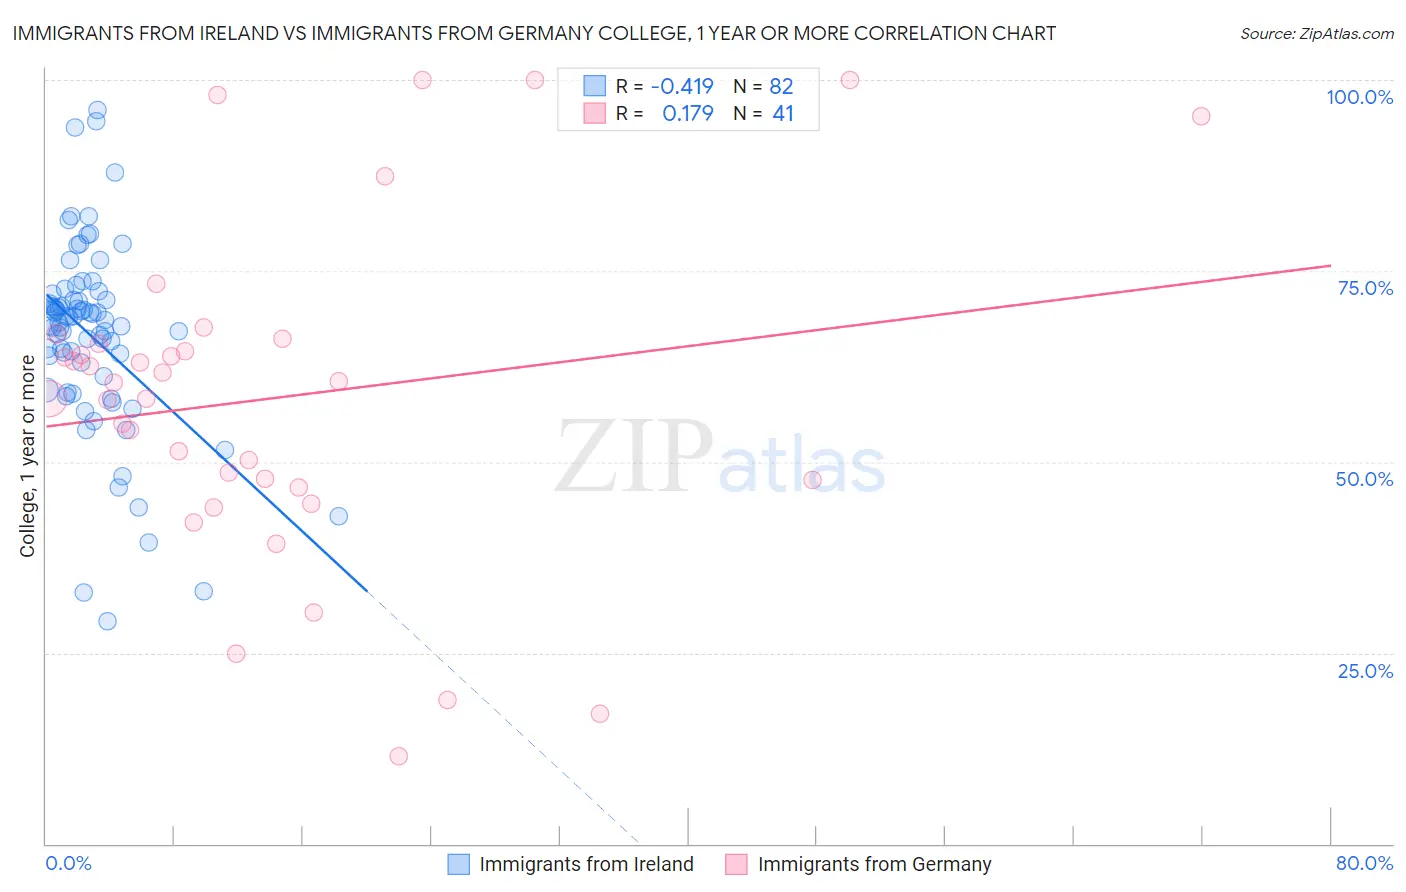
Immigrants from Ireland vs Immigrants from Germany College, 1 year or more Correlation Chart
The statistical analysis conducted on geographies consisting of 240,784,591 people shows a moderate negative correlation between the proportion of Immigrants from Ireland and percentage of population with at least college, 1 year or more education in the United States with a correlation coefficient (R) of -0.419 and weighted average of 65.9%. Similarly, the statistical analysis conducted on geographies consisting of 463,883,930 people shows a poor positive correlation between the proportion of Immigrants from Germany and percentage of population with at least college, 1 year or more education in the United States with a correlation coefficient (R) of 0.179 and weighted average of 60.3%, a difference of 9.3%.
College, 1 year or more Correlation Summary
| Measurement | Immigrants from Ireland | Immigrants from Germany |
| Minimum | 29.2% | 11.4% |
| Maximum | 96.0% | 100.0% |
| Range | 66.9% | 88.6% |
| Mean | 66.5% | 58.4% |
| Median | 68.4% | 60.4% |
| Interquartile 25% (IQ1) | 61.1% | 47.2% |
| Interquartile 75% (IQ3) | 71.3% | 65.8% |
| Interquartile Range (IQR) | 10.1% | 18.6% |
| Standard Deviation (Sample) | 12.4% | 21.6% |
| Standard Deviation (Population) | 12.4% | 21.4% |
Similar Demographics by College, 1 year or more
Demographics Similar to Immigrants from Ireland by College, 1 year or more
In terms of college, 1 year or more, the demographic groups most similar to Immigrants from Ireland are Immigrants from France (65.8%, a difference of 0.17%), Latvian (66.1%, a difference of 0.20%), Indian (Asian) (66.1%, a difference of 0.24%), Immigrants from Northern Europe (65.6%, a difference of 0.42%), and Immigrants from Denmark (65.6%, a difference of 0.53%).
| Demographics | Rating | Rank | College, 1 year or more |
| Immigrants | Korea | 100.0 /100 | #20 | Exceptional 66.5% |
| Immigrants | Hong Kong | 100.0 /100 | #21 | Exceptional 66.4% |
| Soviet Union | 100.0 /100 | #22 | Exceptional 66.4% |
| Immigrants | China | 100.0 /100 | #23 | Exceptional 66.4% |
| Immigrants | Belgium | 100.0 /100 | #24 | Exceptional 66.3% |
| Indians (Asian) | 100.0 /100 | #25 | Exceptional 66.1% |
| Latvians | 100.0 /100 | #26 | Exceptional 66.1% |
| Immigrants | Ireland | 100.0 /100 | #27 | Exceptional 65.9% |
| Immigrants | France | 100.0 /100 | #28 | Exceptional 65.8% |
| Immigrants | Northern Europe | 100.0 /100 | #29 | Exceptional 65.6% |
| Immigrants | Denmark | 100.0 /100 | #30 | Exceptional 65.6% |
| Turks | 100.0 /100 | #31 | Exceptional 65.5% |
| Bulgarians | 100.0 /100 | #32 | Exceptional 65.5% |
| Immigrants | Sri Lanka | 99.9 /100 | #33 | Exceptional 65.4% |
| Israelis | 99.9 /100 | #34 | Exceptional 65.3% |
Demographics Similar to Immigrants from Germany by College, 1 year or more
In terms of college, 1 year or more, the demographic groups most similar to Immigrants from Germany are Immigrants from Sudan (60.4%, a difference of 0.13%), Albanian (60.4%, a difference of 0.13%), Sierra Leonean (60.2%, a difference of 0.14%), Kenyan (60.5%, a difference of 0.22%), and Brazilian (60.5%, a difference of 0.22%).
| Demographics | Rating | Rank | College, 1 year or more |
| Slavs | 81.1 /100 | #145 | Excellent 60.6% |
| Scottish | 80.2 /100 | #146 | Excellent 60.5% |
| Immigrants | Kenya | 79.1 /100 | #147 | Good 60.5% |
| Kenyans | 79.0 /100 | #148 | Good 60.5% |
| Brazilians | 79.0 /100 | #149 | Good 60.5% |
| Immigrants | Sudan | 77.8 /100 | #150 | Good 60.4% |
| Albanians | 77.8 /100 | #151 | Good 60.4% |
| Immigrants | Germany | 76.1 /100 | #152 | Good 60.3% |
| Sierra Leoneans | 74.1 /100 | #153 | Good 60.2% |
| Sudanese | 73.0 /100 | #154 | Good 60.2% |
| Moroccans | 72.9 /100 | #155 | Good 60.2% |
| Finns | 72.9 /100 | #156 | Good 60.2% |
| Immigrants | Armenia | 68.8 /100 | #157 | Good 60.0% |
| English | 67.2 /100 | #158 | Good 60.0% |
| Immigrants | Iraq | 67.0 /100 | #159 | Good 60.0% |