Slavic vs Immigrants from Germany No Vehicles in Household
COMPARE
Slavic
Immigrants from Germany
No Vehicles in Household
No Vehicles in Household Comparison
Slavs
Immigrants from Germany
9.0%
NO VEHICLES IN HOUSEHOLD
98.4/ 100
METRIC RATING
98th/ 347
METRIC RANK
8.7%
NO VEHICLES IN HOUSEHOLD
99.1/ 100
METRIC RATING
91st/ 347
METRIC RANK
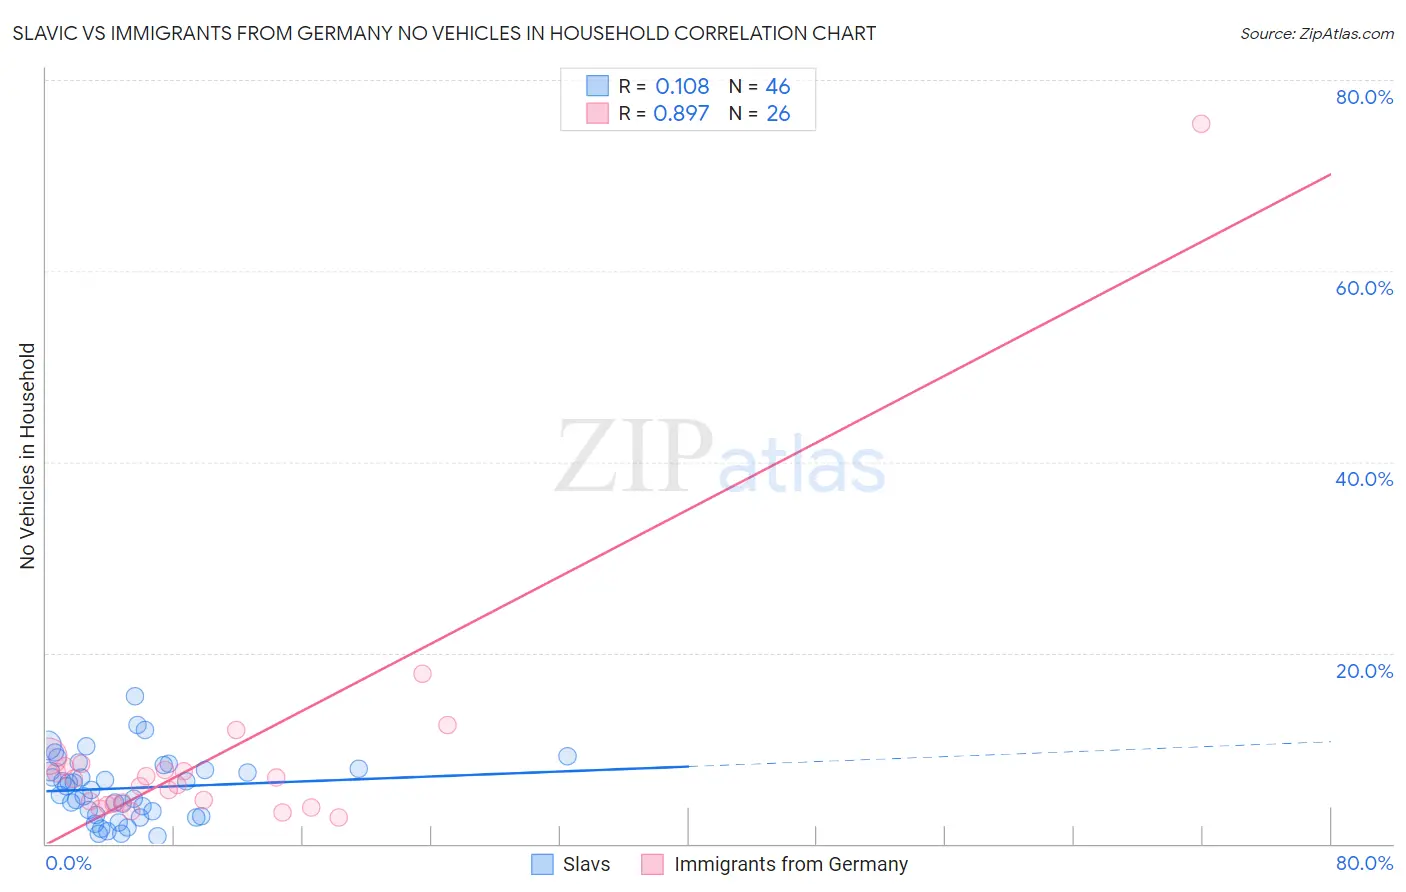
Slavic vs Immigrants from Germany No Vehicles in Household Correlation Chart
The statistical analysis conducted on geographies consisting of 270,391,797 people shows a poor positive correlation between the proportion of Slavs and percentage of households with no vehicle available in the United States with a correlation coefficient (R) of 0.108 and weighted average of 9.0%. Similarly, the statistical analysis conducted on geographies consisting of 462,346,961 people shows a very strong positive correlation between the proportion of Immigrants from Germany and percentage of households with no vehicle available in the United States with a correlation coefficient (R) of 0.897 and weighted average of 8.7%, a difference of 2.5%.
No Vehicles in Household Correlation Summary
| Measurement | Slavic | Immigrants from Germany |
| Minimum | 0.74% | 2.8% |
| Maximum | 15.4% | 75.4% |
| Range | 14.7% | 72.6% |
| Mean | 5.8% | 9.4% |
| Median | 5.8% | 6.4% |
| Interquartile 25% (IQ1) | 3.0% | 4.2% |
| Interquartile 75% (IQ3) | 7.8% | 8.1% |
| Interquartile Range (IQR) | 4.8% | 3.9% |
| Standard Deviation (Sample) | 3.3% | 13.9% |
| Standard Deviation (Population) | 3.3% | 13.6% |
Demographics Similar to Slavs and Immigrants from Germany by No Vehicles in Household
In terms of no vehicles in household, the demographic groups most similar to Slavs are Bulgarian (9.0%, a difference of 0.060%), Asian (9.0%, a difference of 0.24%), Pakistani (9.0%, a difference of 0.28%), Immigrants from Central America (8.9%, a difference of 0.31%), and Yugoslavian (9.0%, a difference of 0.32%). Similarly, the demographic groups most similar to Immigrants from Germany are Immigrants from Canada (8.7%, a difference of 0.030%), Immigrants from North America (8.7%, a difference of 0.17%), Bhutanese (8.7%, a difference of 0.19%), Immigrants from Cuba (8.7%, a difference of 0.28%), and Osage (8.7%, a difference of 0.42%).
| Demographics | Rating | Rank | No Vehicles in Household |
| Immigrants | Jordan | 99.3 /100 | #84 | Exceptional 8.7% |
| Lebanese | 99.3 /100 | #85 | Exceptional 8.7% |
| Bangladeshis | 99.3 /100 | #86 | Exceptional 8.7% |
| Immigrants | England | 99.2 /100 | #87 | Exceptional 8.7% |
| Osage | 99.2 /100 | #88 | Exceptional 8.7% |
| Immigrants | Cuba | 99.2 /100 | #89 | Exceptional 8.7% |
| Bhutanese | 99.2 /100 | #90 | Exceptional 8.7% |
| Immigrants | Germany | 99.1 /100 | #91 | Exceptional 8.7% |
| Immigrants | Canada | 99.1 /100 | #92 | Exceptional 8.7% |
| Immigrants | North America | 99.1 /100 | #93 | Exceptional 8.7% |
| Austrians | 98.9 /100 | #94 | Exceptional 8.8% |
| Potawatomi | 98.8 /100 | #95 | Exceptional 8.8% |
| Immigrants | Bolivia | 98.7 /100 | #96 | Exceptional 8.9% |
| Immigrants | Central America | 98.5 /100 | #97 | Exceptional 8.9% |
| Slavs | 98.4 /100 | #98 | Exceptional 9.0% |
| Bulgarians | 98.4 /100 | #99 | Exceptional 9.0% |
| Asians | 98.3 /100 | #100 | Exceptional 9.0% |
| Pakistanis | 98.3 /100 | #101 | Exceptional 9.0% |
| Yugoslavians | 98.3 /100 | #102 | Exceptional 9.0% |
| Seminole | 98.3 /100 | #103 | Exceptional 9.0% |
| Zimbabweans | 98.0 /100 | #104 | Exceptional 9.0% |