Immigrants from Oceania vs Alsatian College, Under 1 year
COMPARE
Immigrants from Oceania
Alsatian
College, Under 1 year
College, Under 1 year Comparison
Immigrants from Oceania
Alsatians
65.6%
COLLEGE, UNDER 1 YEAR
55.0/ 100
METRIC RATING
171st/ 347
METRIC RANK
67.1%
COLLEGE, UNDER 1 YEAR
91.3/ 100
METRIC RATING
126th/ 347
METRIC RANK
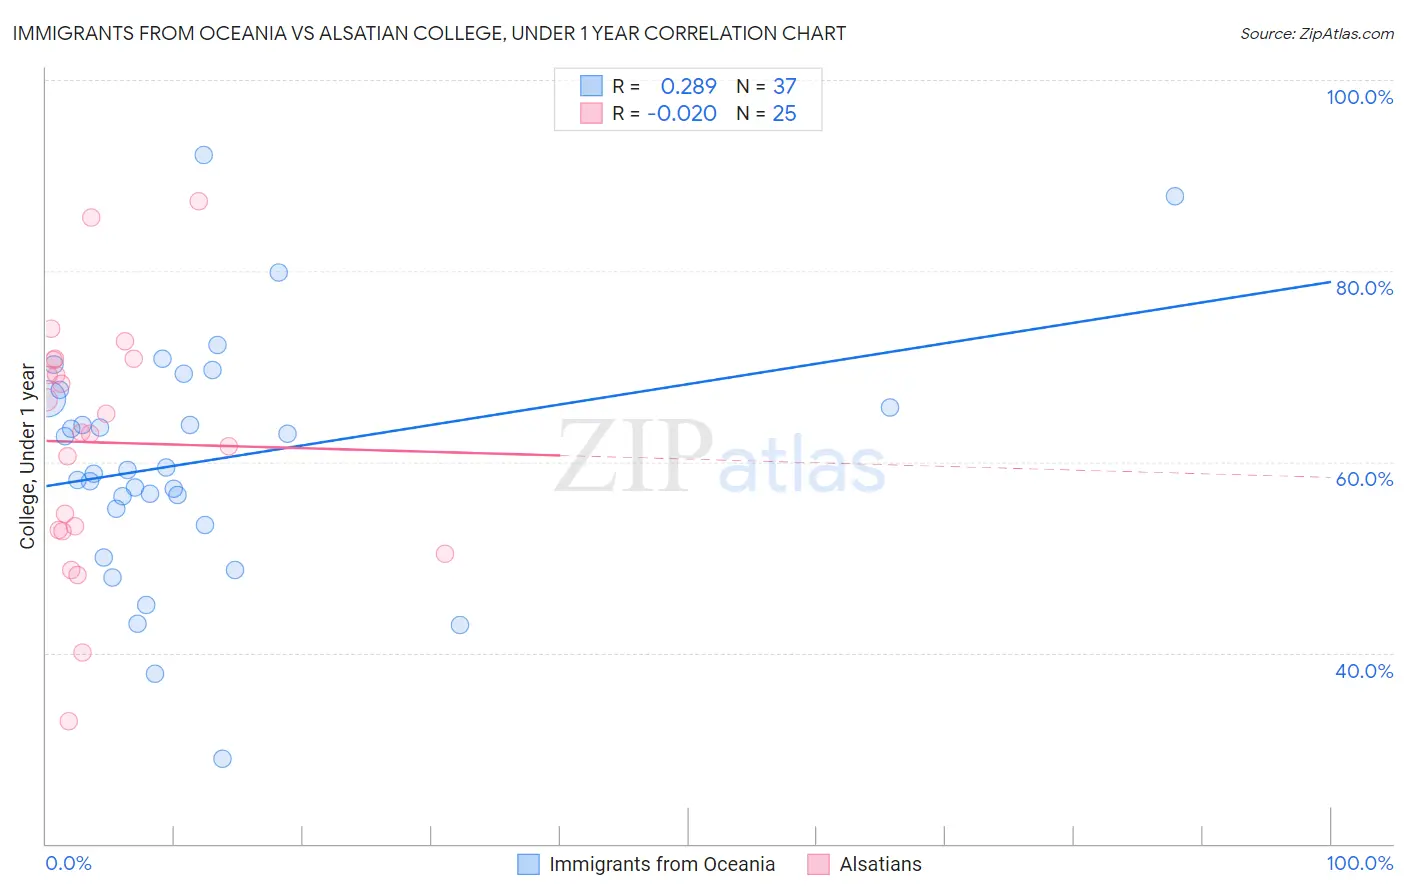
Immigrants from Oceania vs Alsatian College, Under 1 year Correlation Chart
The statistical analysis conducted on geographies consisting of 305,519,500 people shows a weak positive correlation between the proportion of Immigrants from Oceania and percentage of population with at least college, under 1 year education in the United States with a correlation coefficient (R) of 0.289 and weighted average of 65.6%. Similarly, the statistical analysis conducted on geographies consisting of 82,682,365 people shows no correlation between the proportion of Alsatians and percentage of population with at least college, under 1 year education in the United States with a correlation coefficient (R) of -0.020 and weighted average of 67.1%, a difference of 2.4%.
College, Under 1 year Correlation Summary
| Measurement | Immigrants from Oceania | Alsatian |
| Minimum | 28.9% | 32.9% |
| Maximum | 92.2% | 87.3% |
| Range | 63.2% | 54.4% |
| Mean | 60.1% | 62.0% |
| Median | 59.2% | 63.1% |
| Interquartile 25% (IQ1) | 54.3% | 52.8% |
| Interquartile 75% (IQ3) | 67.1% | 70.7% |
| Interquartile Range (IQR) | 12.8% | 17.9% |
| Standard Deviation (Sample) | 12.6% | 12.9% |
| Standard Deviation (Population) | 12.4% | 12.6% |
Similar Demographics by College, Under 1 year
Demographics Similar to Immigrants from Oceania by College, Under 1 year
In terms of college, under 1 year, the demographic groups most similar to Immigrants from Oceania are Yugoslavian (65.6%, a difference of 0.030%), German (65.6%, a difference of 0.030%), South American Indian (65.5%, a difference of 0.030%), Hungarian (65.6%, a difference of 0.040%), and Swiss (65.5%, a difference of 0.050%).
| Demographics | Rating | Rank | College, Under 1 year |
| Czechoslovakians | 62.6 /100 | #164 | Good 65.8% |
| Immigrants | Uzbekistan | 61.6 /100 | #165 | Good 65.8% |
| Moroccans | 56.7 /100 | #166 | Average 65.6% |
| Immigrants | Somalia | 56.4 /100 | #167 | Average 65.6% |
| Hungarians | 55.9 /100 | #168 | Average 65.6% |
| Yugoslavians | 55.7 /100 | #169 | Average 65.6% |
| Germans | 55.7 /100 | #170 | Average 65.6% |
| Immigrants | Oceania | 55.0 /100 | #171 | Average 65.6% |
| South American Indians | 54.4 /100 | #172 | Average 65.5% |
| Swiss | 53.9 /100 | #173 | Average 65.5% |
| Immigrants | Bosnia and Herzegovina | 50.0 /100 | #174 | Average 65.4% |
| Scotch-Irish | 49.5 /100 | #175 | Average 65.4% |
| French | 48.9 /100 | #176 | Average 65.4% |
| Immigrants | North Macedonia | 48.6 /100 | #177 | Average 65.4% |
| German Russians | 48.3 /100 | #178 | Average 65.4% |
Demographics Similar to Alsatians by College, Under 1 year
In terms of college, under 1 year, the demographic groups most similar to Alsatians are Italian (67.2%, a difference of 0.060%), Czech (67.1%, a difference of 0.080%), Scottish (67.0%, a difference of 0.14%), Arab (67.2%, a difference of 0.18%), and Immigrants from Northern Africa (67.2%, a difference of 0.19%).
| Demographics | Rating | Rank | College, Under 1 year |
| Lebanese | 94.6 /100 | #119 | Exceptional 67.5% |
| Serbians | 93.9 /100 | #120 | Exceptional 67.4% |
| Slovenes | 93.3 /100 | #121 | Exceptional 67.3% |
| Immigrants | Jordan | 92.8 /100 | #122 | Exceptional 67.3% |
| Immigrants | Northern Africa | 92.7 /100 | #123 | Exceptional 67.2% |
| Arabs | 92.6 /100 | #124 | Exceptional 67.2% |
| Italians | 91.8 /100 | #125 | Exceptional 67.2% |
| Alsatians | 91.3 /100 | #126 | Exceptional 67.1% |
| Czechs | 90.8 /100 | #127 | Exceptional 67.1% |
| Scottish | 90.2 /100 | #128 | Exceptional 67.0% |
| Immigrants | Eastern Africa | 89.5 /100 | #129 | Excellent 67.0% |
| Immigrants | Syria | 89.0 /100 | #130 | Excellent 66.9% |
| Finns | 88.6 /100 | #131 | Excellent 66.9% |
| Poles | 88.4 /100 | #132 | Excellent 66.9% |
| Immigrants | Brazil | 88.3 /100 | #133 | Excellent 66.9% |