Shoshone vs Creek College, Under 1 year
COMPARE
Shoshone
Creek
College, Under 1 year
College, Under 1 year Comparison
Shoshone
Creek
61.1%
COLLEGE, UNDER 1 YEAR
0.2/ 100
METRIC RATING
263rd/ 347
METRIC RANK
59.3%
COLLEGE, UNDER 1 YEAR
0.0/ 100
METRIC RATING
291st/ 347
METRIC RANK
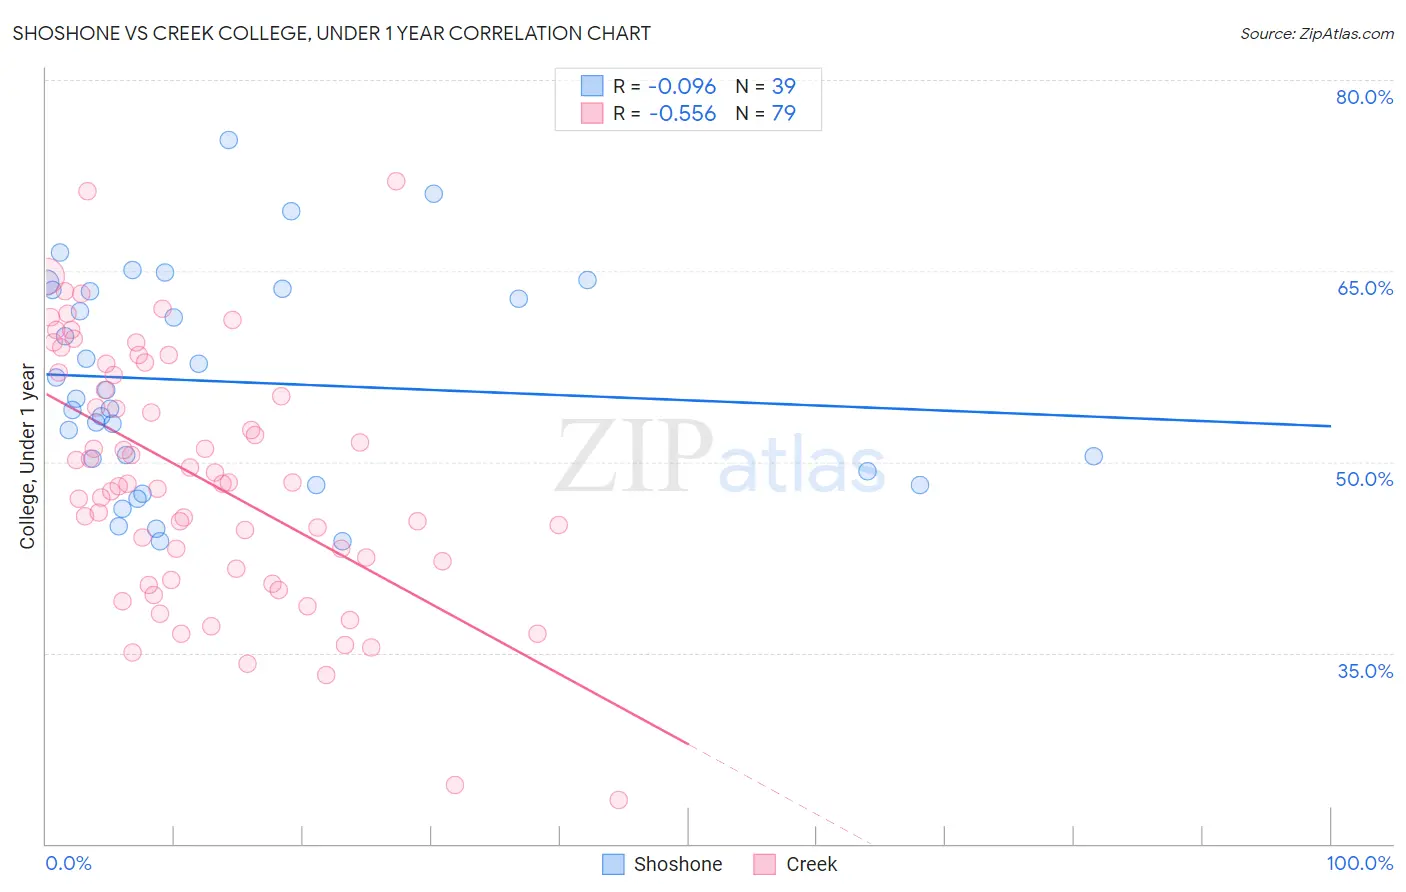
Shoshone vs Creek College, Under 1 year Correlation Chart
The statistical analysis conducted on geographies consisting of 66,627,303 people shows a slight negative correlation between the proportion of Shoshone and percentage of population with at least college, under 1 year education in the United States with a correlation coefficient (R) of -0.096 and weighted average of 61.1%. Similarly, the statistical analysis conducted on geographies consisting of 178,480,346 people shows a substantial negative correlation between the proportion of Creek and percentage of population with at least college, under 1 year education in the United States with a correlation coefficient (R) of -0.556 and weighted average of 59.3%, a difference of 3.1%.
College, Under 1 year Correlation Summary
| Measurement | Shoshone | Creek |
| Minimum | 43.7% | 23.4% |
| Maximum | 75.3% | 72.1% |
| Range | 31.6% | 48.7% |
| Mean | 56.3% | 48.8% |
| Median | 55.0% | 48.2% |
| Interquartile 25% (IQ1) | 49.3% | 41.6% |
| Interquartile 75% (IQ3) | 63.5% | 57.0% |
| Interquartile Range (IQR) | 14.2% | 15.4% |
| Standard Deviation (Sample) | 8.2% | 9.9% |
| Standard Deviation (Population) | 8.1% | 9.8% |
Similar Demographics by College, Under 1 year
Demographics Similar to Shoshone by College, Under 1 year
In terms of college, under 1 year, the demographic groups most similar to Shoshone are Barbadian (61.1%, a difference of 0.010%), African (61.1%, a difference of 0.050%), Trinidadian and Tobagonian (61.1%, a difference of 0.060%), Immigrants from Bahamas (61.1%, a difference of 0.060%), and Blackfeet (61.1%, a difference of 0.070%).
| Demographics | Rating | Rank | College, Under 1 year |
| Bangladeshis | 0.4 /100 | #256 | Tragic 61.4% |
| Immigrants | Laos | 0.3 /100 | #257 | Tragic 61.3% |
| Immigrants | Bangladesh | 0.3 /100 | #258 | Tragic 61.3% |
| Indonesians | 0.3 /100 | #259 | Tragic 61.2% |
| Blackfeet | 0.3 /100 | #260 | Tragic 61.1% |
| Africans | 0.3 /100 | #261 | Tragic 61.1% |
| Barbadians | 0.2 /100 | #262 | Tragic 61.1% |
| Shoshone | 0.2 /100 | #263 | Tragic 61.1% |
| Trinidadians and Tobagonians | 0.2 /100 | #264 | Tragic 61.1% |
| Immigrants | Bahamas | 0.2 /100 | #265 | Tragic 61.1% |
| Alaskan Athabascans | 0.2 /100 | #266 | Tragic 61.0% |
| Americans | 0.2 /100 | #267 | Tragic 61.0% |
| Immigrants | Trinidad and Tobago | 0.1 /100 | #268 | Tragic 60.7% |
| Immigrants | West Indies | 0.1 /100 | #269 | Tragic 60.6% |
| Cheyenne | 0.1 /100 | #270 | Tragic 60.6% |
Demographics Similar to Creek by College, Under 1 year
In terms of college, under 1 year, the demographic groups most similar to Creek are Nicaraguan (59.2%, a difference of 0.040%), Ecuadorian (59.3%, a difference of 0.090%), Choctaw (59.3%, a difference of 0.13%), Black/African American (59.4%, a difference of 0.20%), and Seminole (59.1%, a difference of 0.23%).
| Demographics | Rating | Rank | College, Under 1 year |
| Immigrants | St. Vincent and the Grenadines | 0.0 /100 | #284 | Tragic 59.6% |
| Paiute | 0.0 /100 | #285 | Tragic 59.6% |
| British West Indians | 0.0 /100 | #286 | Tragic 59.5% |
| Sioux | 0.0 /100 | #287 | Tragic 59.4% |
| Blacks/African Americans | 0.0 /100 | #288 | Tragic 59.4% |
| Choctaw | 0.0 /100 | #289 | Tragic 59.3% |
| Ecuadorians | 0.0 /100 | #290 | Tragic 59.3% |
| Creek | 0.0 /100 | #291 | Tragic 59.3% |
| Nicaraguans | 0.0 /100 | #292 | Tragic 59.2% |
| Seminole | 0.0 /100 | #293 | Tragic 59.1% |
| Immigrants | Belize | 0.0 /100 | #294 | Tragic 59.1% |
| Immigrants | Grenada | 0.0 /100 | #295 | Tragic 59.1% |
| Central American Indians | 0.0 /100 | #296 | Tragic 59.0% |
| Guyanese | 0.0 /100 | #297 | Tragic 59.0% |
| Immigrants | Ecuador | 0.0 /100 | #298 | Tragic 58.7% |