Shoshone vs Tsimshian College, Under 1 year
COMPARE
Shoshone
Tsimshian
College, Under 1 year
College, Under 1 year Comparison
Shoshone
Tsimshian
61.1%
COLLEGE, UNDER 1 YEAR
0.2/ 100
METRIC RATING
263rd/ 347
METRIC RANK
64.3%
COLLEGE, UNDER 1 YEAR
17.9/ 100
METRIC RATING
198th/ 347
METRIC RANK
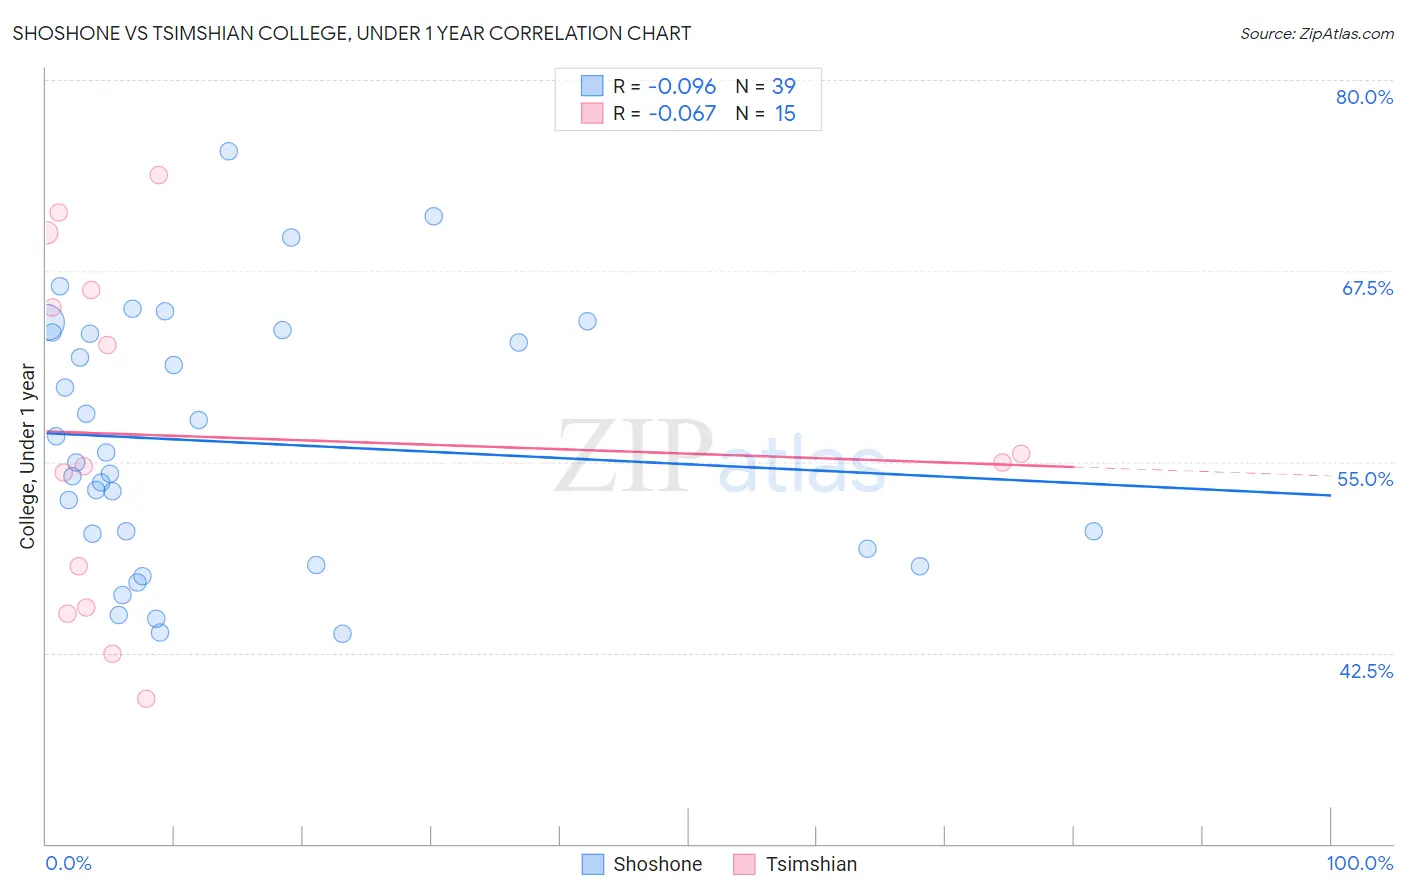
Shoshone vs Tsimshian College, Under 1 year Correlation Chart
The statistical analysis conducted on geographies consisting of 66,627,303 people shows a slight negative correlation between the proportion of Shoshone and percentage of population with at least college, under 1 year education in the United States with a correlation coefficient (R) of -0.096 and weighted average of 61.1%. Similarly, the statistical analysis conducted on geographies consisting of 15,626,544 people shows a slight negative correlation between the proportion of Tsimshian and percentage of population with at least college, under 1 year education in the United States with a correlation coefficient (R) of -0.067 and weighted average of 64.3%, a difference of 5.3%.
College, Under 1 year Correlation Summary
| Measurement | Shoshone | Tsimshian |
| Minimum | 43.7% | 39.5% |
| Maximum | 75.3% | 73.8% |
| Range | 31.6% | 34.3% |
| Mean | 56.3% | 56.6% |
| Median | 55.0% | 54.9% |
| Interquartile 25% (IQ1) | 49.3% | 45.5% |
| Interquartile 75% (IQ3) | 63.5% | 66.2% |
| Interquartile Range (IQR) | 14.2% | 20.8% |
| Standard Deviation (Sample) | 8.2% | 11.1% |
| Standard Deviation (Population) | 8.1% | 10.7% |
Similar Demographics by College, Under 1 year
Demographics Similar to Shoshone by College, Under 1 year
In terms of college, under 1 year, the demographic groups most similar to Shoshone are Barbadian (61.1%, a difference of 0.010%), African (61.1%, a difference of 0.050%), Trinidadian and Tobagonian (61.1%, a difference of 0.060%), Immigrants from Bahamas (61.1%, a difference of 0.060%), and Blackfeet (61.1%, a difference of 0.070%).
| Demographics | Rating | Rank | College, Under 1 year |
| Bangladeshis | 0.4 /100 | #256 | Tragic 61.4% |
| Immigrants | Laos | 0.3 /100 | #257 | Tragic 61.3% |
| Immigrants | Bangladesh | 0.3 /100 | #258 | Tragic 61.3% |
| Indonesians | 0.3 /100 | #259 | Tragic 61.2% |
| Blackfeet | 0.3 /100 | #260 | Tragic 61.1% |
| Africans | 0.3 /100 | #261 | Tragic 61.1% |
| Barbadians | 0.2 /100 | #262 | Tragic 61.1% |
| Shoshone | 0.2 /100 | #263 | Tragic 61.1% |
| Trinidadians and Tobagonians | 0.2 /100 | #264 | Tragic 61.1% |
| Immigrants | Bahamas | 0.2 /100 | #265 | Tragic 61.1% |
| Alaskan Athabascans | 0.2 /100 | #266 | Tragic 61.0% |
| Americans | 0.2 /100 | #267 | Tragic 61.0% |
| Immigrants | Trinidad and Tobago | 0.1 /100 | #268 | Tragic 60.7% |
| Immigrants | West Indies | 0.1 /100 | #269 | Tragic 60.6% |
| Cheyenne | 0.1 /100 | #270 | Tragic 60.6% |
Demographics Similar to Tsimshian by College, Under 1 year
In terms of college, under 1 year, the demographic groups most similar to Tsimshian are Panamanian (64.3%, a difference of 0.070%), Nigerian (64.3%, a difference of 0.090%), Costa Rican (64.4%, a difference of 0.13%), French Canadian (64.2%, a difference of 0.13%), and South American (64.2%, a difference of 0.13%).
| Demographics | Rating | Rank | College, Under 1 year |
| Immigrants | Armenia | 28.1 /100 | #191 | Fair 64.7% |
| Immigrants | Thailand | 27.0 /100 | #192 | Fair 64.7% |
| Slovaks | 26.7 /100 | #193 | Fair 64.7% |
| Immigrants | Cameroon | 24.6 /100 | #194 | Fair 64.6% |
| Immigrants | South Eastern Asia | 22.1 /100 | #195 | Fair 64.5% |
| Tongans | 21.2 /100 | #196 | Fair 64.5% |
| Costa Ricans | 19.6 /100 | #197 | Poor 64.4% |
| Tsimshian | 17.9 /100 | #198 | Poor 64.3% |
| Panamanians | 17.0 /100 | #199 | Poor 64.3% |
| Nigerians | 16.7 /100 | #200 | Poor 64.3% |
| French Canadians | 16.3 /100 | #201 | Poor 64.2% |
| South Americans | 16.2 /100 | #202 | Poor 64.2% |
| Uruguayans | 15.6 /100 | #203 | Poor 64.2% |
| Immigrants | Zaire | 14.6 /100 | #204 | Poor 64.1% |
| Peruvians | 13.7 /100 | #205 | Poor 64.1% |