Shoshone vs Tlingit-Haida College, Under 1 year
COMPARE
Shoshone
Tlingit-Haida
College, Under 1 year
College, Under 1 year Comparison
Shoshone
Tlingit-Haida
61.1%
COLLEGE, UNDER 1 YEAR
0.2/ 100
METRIC RATING
263rd/ 347
METRIC RANK
65.9%
COLLEGE, UNDER 1 YEAR
66.4/ 100
METRIC RATING
159th/ 347
METRIC RANK
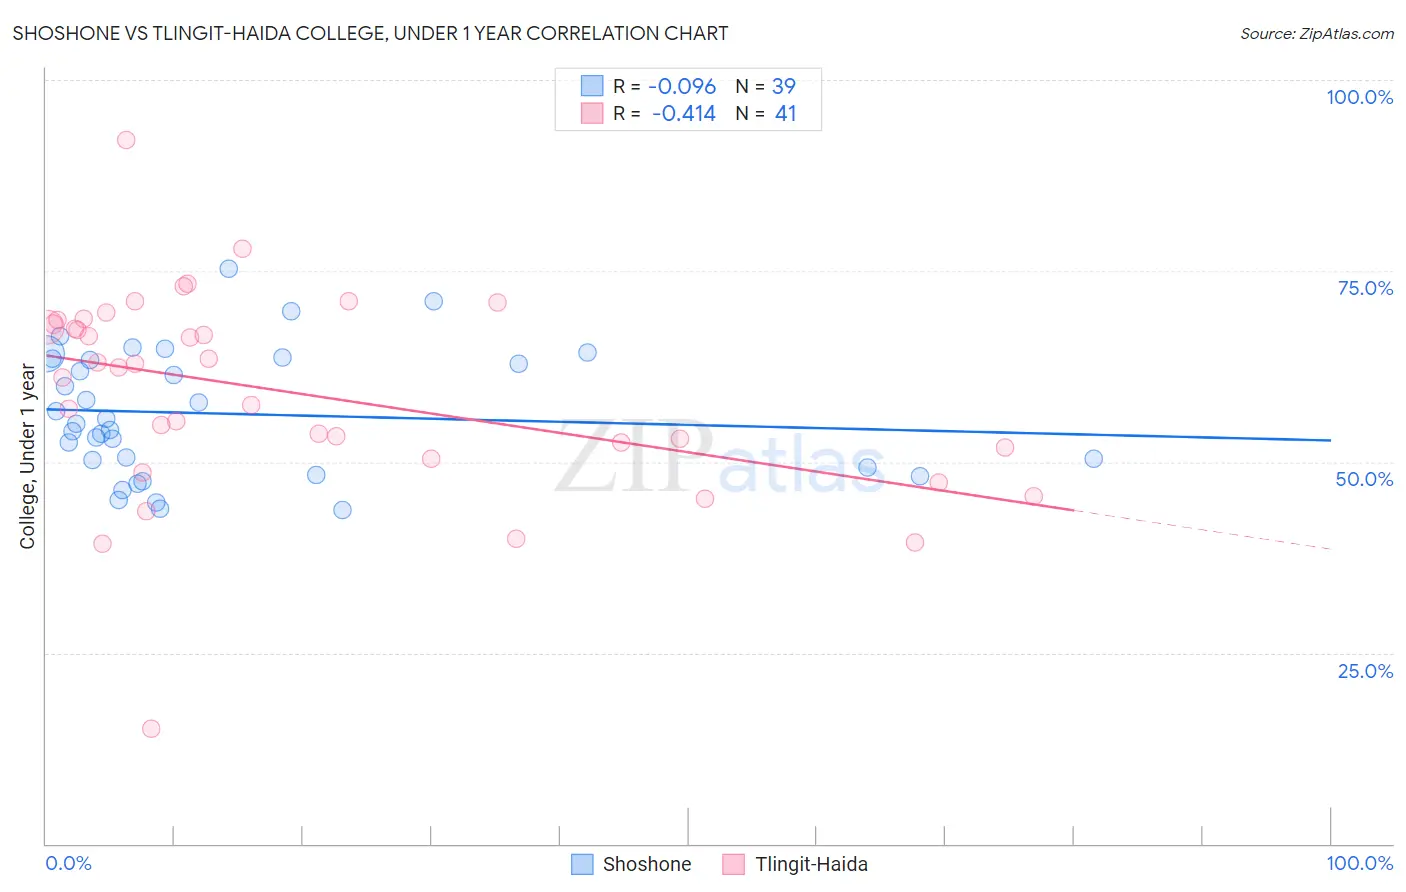
Shoshone vs Tlingit-Haida College, Under 1 year Correlation Chart
The statistical analysis conducted on geographies consisting of 66,627,303 people shows a slight negative correlation between the proportion of Shoshone and percentage of population with at least college, under 1 year education in the United States with a correlation coefficient (R) of -0.096 and weighted average of 61.1%. Similarly, the statistical analysis conducted on geographies consisting of 60,871,919 people shows a moderate negative correlation between the proportion of Tlingit-Haida and percentage of population with at least college, under 1 year education in the United States with a correlation coefficient (R) of -0.414 and weighted average of 65.9%, a difference of 7.9%.
College, Under 1 year Correlation Summary
| Measurement | Shoshone | Tlingit-Haida |
| Minimum | 43.7% | 15.0% |
| Maximum | 75.3% | 92.1% |
| Range | 31.6% | 77.1% |
| Mean | 56.3% | 59.1% |
| Median | 55.0% | 62.3% |
| Interquartile 25% (IQ1) | 49.3% | 51.2% |
| Interquartile 75% (IQ3) | 63.5% | 68.3% |
| Interquartile Range (IQR) | 14.2% | 17.2% |
| Standard Deviation (Sample) | 8.2% | 13.5% |
| Standard Deviation (Population) | 8.1% | 13.4% |
Similar Demographics by College, Under 1 year
Demographics Similar to Shoshone by College, Under 1 year
In terms of college, under 1 year, the demographic groups most similar to Shoshone are Barbadian (61.1%, a difference of 0.010%), African (61.1%, a difference of 0.050%), Trinidadian and Tobagonian (61.1%, a difference of 0.060%), Immigrants from Bahamas (61.1%, a difference of 0.060%), and Blackfeet (61.1%, a difference of 0.070%).
| Demographics | Rating | Rank | College, Under 1 year |
| Bangladeshis | 0.4 /100 | #256 | Tragic 61.4% |
| Immigrants | Laos | 0.3 /100 | #257 | Tragic 61.3% |
| Immigrants | Bangladesh | 0.3 /100 | #258 | Tragic 61.3% |
| Indonesians | 0.3 /100 | #259 | Tragic 61.2% |
| Blackfeet | 0.3 /100 | #260 | Tragic 61.1% |
| Africans | 0.3 /100 | #261 | Tragic 61.1% |
| Barbadians | 0.2 /100 | #262 | Tragic 61.1% |
| Shoshone | 0.2 /100 | #263 | Tragic 61.1% |
| Trinidadians and Tobagonians | 0.2 /100 | #264 | Tragic 61.1% |
| Immigrants | Bahamas | 0.2 /100 | #265 | Tragic 61.1% |
| Alaskan Athabascans | 0.2 /100 | #266 | Tragic 61.0% |
| Americans | 0.2 /100 | #267 | Tragic 61.0% |
| Immigrants | Trinidad and Tobago | 0.1 /100 | #268 | Tragic 60.7% |
| Immigrants | West Indies | 0.1 /100 | #269 | Tragic 60.6% |
| Cheyenne | 0.1 /100 | #270 | Tragic 60.6% |
Demographics Similar to Tlingit-Haida by College, Under 1 year
In terms of college, under 1 year, the demographic groups most similar to Tlingit-Haida are Albanian (65.9%, a difference of 0.010%), Brazilian (65.9%, a difference of 0.020%), Celtic (65.9%, a difference of 0.050%), Korean (65.9%, a difference of 0.050%), and Sierra Leonean (66.0%, a difference of 0.070%).
| Demographics | Rating | Rank | College, Under 1 year |
| Sudanese | 74.1 /100 | #152 | Good 66.2% |
| Belgians | 73.7 /100 | #153 | Good 66.2% |
| Immigrants | Eritrea | 71.9 /100 | #154 | Good 66.1% |
| Irish | 70.3 /100 | #155 | Good 66.0% |
| Welsh | 69.9 /100 | #156 | Good 66.0% |
| Sierra Leoneans | 67.8 /100 | #157 | Good 66.0% |
| Celtics | 67.3 /100 | #158 | Good 65.9% |
| Tlingit-Haida | 66.4 /100 | #159 | Good 65.9% |
| Albanians | 66.1 /100 | #160 | Good 65.9% |
| Brazilians | 66.0 /100 | #161 | Good 65.9% |
| Koreans | 65.3 /100 | #162 | Good 65.9% |
| Somalis | 62.7 /100 | #163 | Good 65.8% |
| Czechoslovakians | 62.6 /100 | #164 | Good 65.8% |
| Immigrants | Uzbekistan | 61.6 /100 | #165 | Good 65.8% |
| Moroccans | 56.7 /100 | #166 | Average 65.6% |