Arapaho vs Alsatian College, Under 1 year
COMPARE
Arapaho
Alsatian
College, Under 1 year
College, Under 1 year Comparison
Arapaho
Alsatians
60.3%
COLLEGE, UNDER 1 YEAR
0.1/ 100
METRIC RATING
276th/ 347
METRIC RANK
67.1%
COLLEGE, UNDER 1 YEAR
91.3/ 100
METRIC RATING
126th/ 347
METRIC RANK
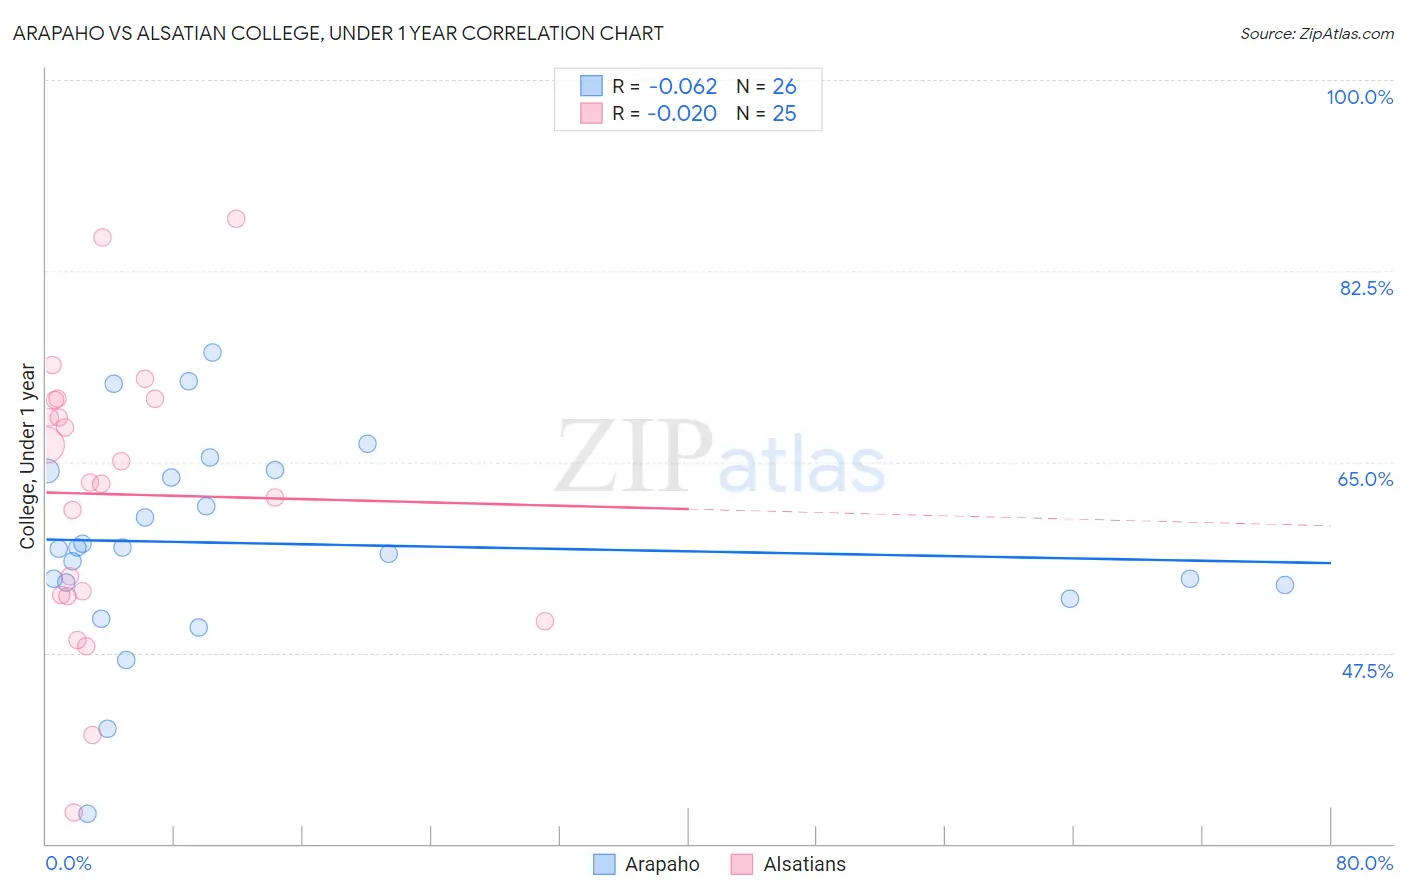
Arapaho vs Alsatian College, Under 1 year Correlation Chart
The statistical analysis conducted on geographies consisting of 29,780,040 people shows a slight negative correlation between the proportion of Arapaho and percentage of population with at least college, under 1 year education in the United States with a correlation coefficient (R) of -0.062 and weighted average of 60.3%. Similarly, the statistical analysis conducted on geographies consisting of 82,682,365 people shows no correlation between the proportion of Alsatians and percentage of population with at least college, under 1 year education in the United States with a correlation coefficient (R) of -0.020 and weighted average of 67.1%, a difference of 11.2%.
College, Under 1 year Correlation Summary
| Measurement | Arapaho | Alsatian |
| Minimum | 32.8% | 32.9% |
| Maximum | 75.0% | 87.3% |
| Range | 42.2% | 54.4% |
| Mean | 57.5% | 62.0% |
| Median | 57.1% | 63.1% |
| Interquartile 25% (IQ1) | 53.7% | 52.8% |
| Interquartile 75% (IQ3) | 64.1% | 70.7% |
| Interquartile Range (IQR) | 10.4% | 17.9% |
| Standard Deviation (Sample) | 9.4% | 12.9% |
| Standard Deviation (Population) | 9.3% | 12.6% |
Similar Demographics by College, Under 1 year
Demographics Similar to Arapaho by College, Under 1 year
In terms of college, under 1 year, the demographic groups most similar to Arapaho are Immigrants from Barbados (60.4%, a difference of 0.030%), Bahamian (60.3%, a difference of 0.14%), Chickasaw (60.4%, a difference of 0.16%), Alaska Native (60.4%, a difference of 0.16%), and Yaqui (60.2%, a difference of 0.17%).
| Demographics | Rating | Rank | College, Under 1 year |
| Immigrants | West Indies | 0.1 /100 | #269 | Tragic 60.6% |
| Cheyenne | 0.1 /100 | #270 | Tragic 60.6% |
| U.S. Virgin Islanders | 0.1 /100 | #271 | Tragic 60.6% |
| Jamaicans | 0.1 /100 | #272 | Tragic 60.5% |
| Chickasaw | 0.1 /100 | #273 | Tragic 60.4% |
| Alaska Natives | 0.1 /100 | #274 | Tragic 60.4% |
| Immigrants | Barbados | 0.1 /100 | #275 | Tragic 60.4% |
| Arapaho | 0.1 /100 | #276 | Tragic 60.3% |
| Bahamians | 0.1 /100 | #277 | Tragic 60.3% |
| Yaqui | 0.1 /100 | #278 | Tragic 60.2% |
| Ute | 0.1 /100 | #279 | Tragic 60.2% |
| Crow | 0.1 /100 | #280 | Tragic 60.2% |
| Cherokee | 0.1 /100 | #281 | Tragic 60.1% |
| Belizeans | 0.1 /100 | #282 | Tragic 60.1% |
| Immigrants | Jamaica | 0.0 /100 | #283 | Tragic 59.7% |
Demographics Similar to Alsatians by College, Under 1 year
In terms of college, under 1 year, the demographic groups most similar to Alsatians are Italian (67.2%, a difference of 0.060%), Czech (67.1%, a difference of 0.080%), Scottish (67.0%, a difference of 0.14%), Arab (67.2%, a difference of 0.18%), and Immigrants from Northern Africa (67.2%, a difference of 0.19%).
| Demographics | Rating | Rank | College, Under 1 year |
| Lebanese | 94.6 /100 | #119 | Exceptional 67.5% |
| Serbians | 93.9 /100 | #120 | Exceptional 67.4% |
| Slovenes | 93.3 /100 | #121 | Exceptional 67.3% |
| Immigrants | Jordan | 92.8 /100 | #122 | Exceptional 67.3% |
| Immigrants | Northern Africa | 92.7 /100 | #123 | Exceptional 67.2% |
| Arabs | 92.6 /100 | #124 | Exceptional 67.2% |
| Italians | 91.8 /100 | #125 | Exceptional 67.2% |
| Alsatians | 91.3 /100 | #126 | Exceptional 67.1% |
| Czechs | 90.8 /100 | #127 | Exceptional 67.1% |
| Scottish | 90.2 /100 | #128 | Exceptional 67.0% |
| Immigrants | Eastern Africa | 89.5 /100 | #129 | Excellent 67.0% |
| Immigrants | Syria | 89.0 /100 | #130 | Excellent 66.9% |
| Finns | 88.6 /100 | #131 | Excellent 66.9% |
| Poles | 88.4 /100 | #132 | Excellent 66.9% |
| Immigrants | Brazil | 88.3 /100 | #133 | Excellent 66.9% |