Scotch-Irish vs Tsimshian Bachelor's Degree
COMPARE
Scotch-Irish
Tsimshian
Bachelor's Degree
Bachelor's Degree Comparison
Scotch-Irish
Tsimshian
36.4%
BACHELOR'S DEGREE
18.3/ 100
METRIC RATING
211th/ 347
METRIC RANK
28.8%
BACHELOR'S DEGREE
0.0/ 100
METRIC RATING
322nd/ 347
METRIC RANK
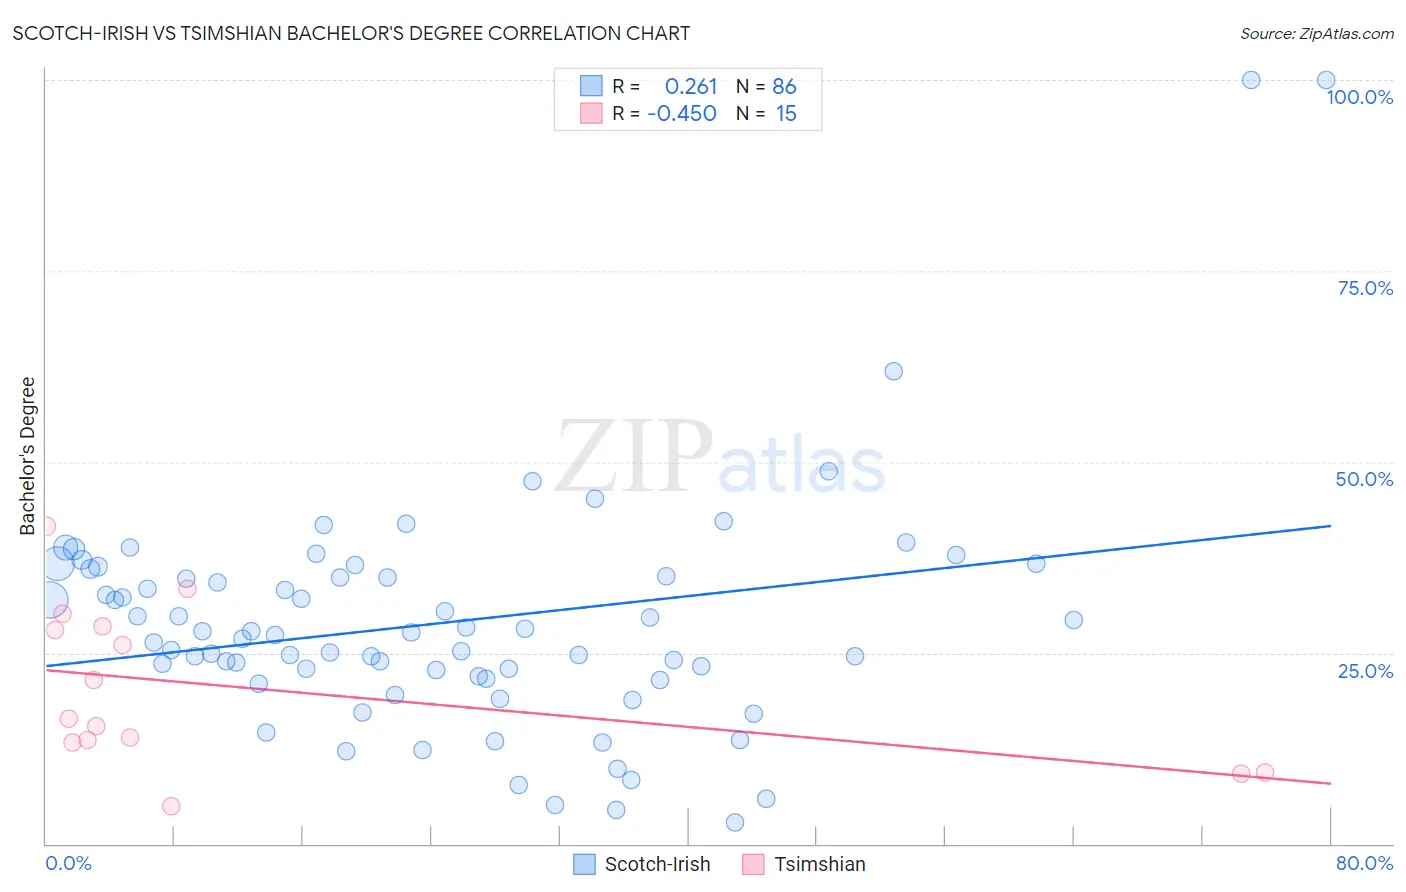
Scotch-Irish vs Tsimshian Bachelor's Degree Correlation Chart
The statistical analysis conducted on geographies consisting of 548,685,901 people shows a weak positive correlation between the proportion of Scotch-Irish and percentage of population with at least bachelor's degree education in the United States with a correlation coefficient (R) of 0.261 and weighted average of 36.4%. Similarly, the statistical analysis conducted on geographies consisting of 15,626,544 people shows a moderate negative correlation between the proportion of Tsimshian and percentage of population with at least bachelor's degree education in the United States with a correlation coefficient (R) of -0.450 and weighted average of 28.8%, a difference of 26.7%.
Bachelor's Degree Correlation Summary
| Measurement | Scotch-Irish | Tsimshian |
| Minimum | 2.9% | 4.9% |
| Maximum | 100.0% | 41.6% |
| Range | 97.1% | 36.7% |
| Mean | 28.9% | 20.3% |
| Median | 27.5% | 16.4% |
| Interquartile 25% (IQ1) | 21.9% | 13.3% |
| Interquartile 75% (IQ3) | 35.1% | 28.5% |
| Interquartile Range (IQR) | 13.2% | 15.3% |
| Standard Deviation (Sample) | 15.4% | 10.5% |
| Standard Deviation (Population) | 15.3% | 10.1% |
Similar Demographics by Bachelor's Degree
Demographics Similar to Scotch-Irish by Bachelor's Degree
In terms of bachelor's degree, the demographic groups most similar to Scotch-Irish are French (36.5%, a difference of 0.050%), Panamanian (36.5%, a difference of 0.080%), Immigrants from Philippines (36.4%, a difference of 0.080%), Immigrants from Thailand (36.5%, a difference of 0.18%), and Immigrants from Middle Africa (36.6%, a difference of 0.38%).
| Demographics | Rating | Rank | Bachelor's Degree |
| Immigrants | Immigrants | 22.8 /100 | #204 | Fair 36.7% |
| Finns | 22.2 /100 | #205 | Fair 36.7% |
| Spaniards | 21.2 /100 | #206 | Fair 36.6% |
| Immigrants | Middle Africa | 20.6 /100 | #207 | Fair 36.6% |
| Immigrants | Thailand | 19.4 /100 | #208 | Poor 36.5% |
| Panamanians | 18.8 /100 | #209 | Poor 36.5% |
| French | 18.6 /100 | #210 | Poor 36.5% |
| Scotch-Irish | 18.3 /100 | #211 | Poor 36.4% |
| Immigrants | Philippines | 17.8 /100 | #212 | Poor 36.4% |
| Immigrants | Panama | 14.2 /100 | #213 | Poor 36.2% |
| Germans | 13.9 /100 | #214 | Poor 36.1% |
| Immigrants | Western Africa | 13.8 /100 | #215 | Poor 36.1% |
| Barbadians | 13.5 /100 | #216 | Poor 36.1% |
| German Russians | 10.2 /100 | #217 | Poor 35.8% |
| Sub-Saharan Africans | 9.8 /100 | #218 | Tragic 35.8% |
Demographics Similar to Tsimshian by Bachelor's Degree
In terms of bachelor's degree, the demographic groups most similar to Tsimshian are Fijian (28.7%, a difference of 0.14%), Alaskan Athabascan (28.8%, a difference of 0.22%), Kiowa (28.8%, a difference of 0.30%), Creek (28.9%, a difference of 0.35%), and Yaqui (29.0%, a difference of 0.80%).
| Demographics | Rating | Rank | Bachelor's Degree |
| Immigrants | Cabo Verde | 0.0 /100 | #315 | Tragic 29.2% |
| Sioux | 0.0 /100 | #316 | Tragic 29.1% |
| Colville | 0.0 /100 | #317 | Tragic 29.0% |
| Yaqui | 0.0 /100 | #318 | Tragic 29.0% |
| Creek | 0.0 /100 | #319 | Tragic 28.9% |
| Kiowa | 0.0 /100 | #320 | Tragic 28.8% |
| Alaskan Athabascans | 0.0 /100 | #321 | Tragic 28.8% |
| Tsimshian | 0.0 /100 | #322 | Tragic 28.8% |
| Fijians | 0.0 /100 | #323 | Tragic 28.7% |
| Dutch West Indians | 0.0 /100 | #324 | Tragic 28.5% |
| Pennsylvania Germans | 0.0 /100 | #325 | Tragic 28.4% |
| Apache | 0.0 /100 | #326 | Tragic 28.3% |
| Paiute | 0.0 /100 | #327 | Tragic 28.1% |
| Crow | 0.0 /100 | #328 | Tragic 27.7% |
| Immigrants | Central America | 0.0 /100 | #329 | Tragic 27.5% |