Immigrants from Chile vs Tsimshian 11th Grade
COMPARE
Immigrants from Chile
Tsimshian
11th Grade
11th Grade Comparison
Immigrants from Chile
Tsimshian
92.4%
11TH GRADE
33.3/ 100
METRIC RATING
189th/ 347
METRIC RANK
94.4%
11TH GRADE
100.0/ 100
METRIC RATING
22nd/ 347
METRIC RANK
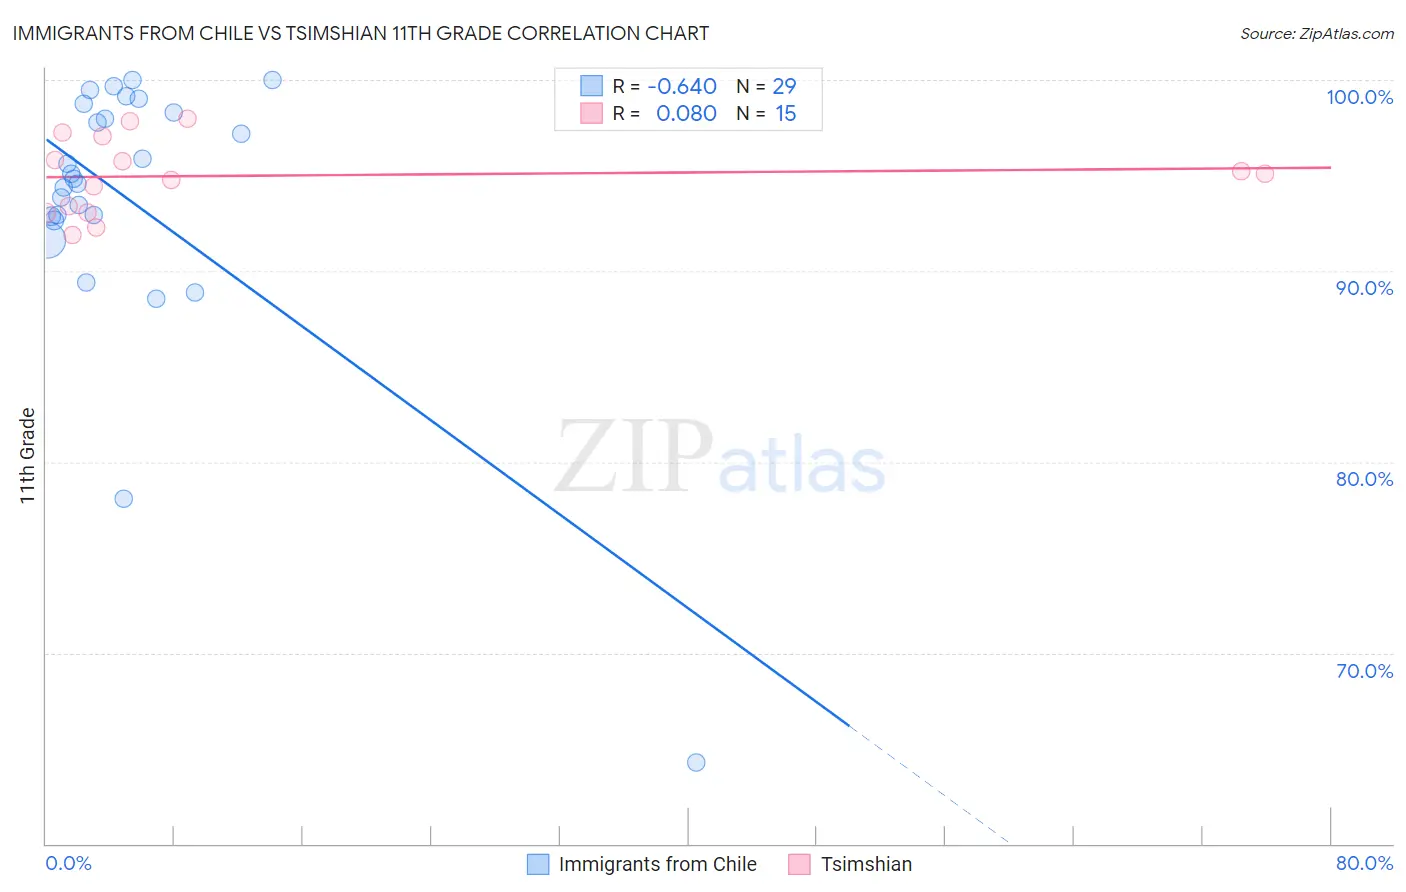
Immigrants from Chile vs Tsimshian 11th Grade Correlation Chart
The statistical analysis conducted on geographies consisting of 218,647,266 people shows a significant negative correlation between the proportion of Immigrants from Chile and percentage of population with at least 11th grade education in the United States with a correlation coefficient (R) of -0.640 and weighted average of 92.4%. Similarly, the statistical analysis conducted on geographies consisting of 15,626,544 people shows a slight positive correlation between the proportion of Tsimshian and percentage of population with at least 11th grade education in the United States with a correlation coefficient (R) of 0.080 and weighted average of 94.4%, a difference of 2.2%.
11th Grade Correlation Summary
| Measurement | Immigrants from Chile | Tsimshian |
| Minimum | 64.3% | 91.9% |
| Maximum | 100.0% | 98.0% |
| Range | 35.7% | 6.1% |
| Mean | 93.7% | 95.0% |
| Median | 94.8% | 95.1% |
| Interquartile 25% (IQ1) | 92.8% | 93.1% |
| Interquartile 75% (IQ3) | 98.5% | 97.0% |
| Interquartile Range (IQR) | 5.8% | 4.0% |
| Standard Deviation (Sample) | 7.3% | 2.0% |
| Standard Deviation (Population) | 7.2% | 1.9% |
Similar Demographics by 11th Grade
Demographics Similar to Immigrants from Chile by 11th Grade
In terms of 11th grade, the demographic groups most similar to Immigrants from Chile are Immigrants from Indonesia (92.4%, a difference of 0.0%), Arapaho (92.4%, a difference of 0.020%), Immigrants from Western Asia (92.4%, a difference of 0.020%), Chickasaw (92.3%, a difference of 0.020%), and Immigrants from Nepal (92.4%, a difference of 0.030%).
| Demographics | Rating | Rank | 11th Grade |
| Immigrants | Morocco | 38.6 /100 | #182 | Fair 92.4% |
| Immigrants | Malaysia | 37.6 /100 | #183 | Fair 92.4% |
| Immigrants | Asia | 37.4 /100 | #184 | Fair 92.4% |
| Immigrants | Nepal | 36.4 /100 | #185 | Fair 92.4% |
| Arapaho | 35.1 /100 | #186 | Fair 92.4% |
| Immigrants | Western Asia | 35.0 /100 | #187 | Fair 92.4% |
| Immigrants | Indonesia | 33.7 /100 | #188 | Fair 92.4% |
| Immigrants | Chile | 33.3 /100 | #189 | Fair 92.4% |
| Chickasaw | 31.4 /100 | #190 | Fair 92.3% |
| French American Indians | 30.8 /100 | #191 | Fair 92.3% |
| Immigrants | Syria | 30.4 /100 | #192 | Fair 92.3% |
| Moroccans | 28.7 /100 | #193 | Fair 92.3% |
| Sioux | 28.5 /100 | #194 | Fair 92.3% |
| Liberians | 26.8 /100 | #195 | Fair 92.3% |
| Panamanians | 26.4 /100 | #196 | Fair 92.3% |
Demographics Similar to Tsimshian by 11th Grade
In terms of 11th grade, the demographic groups most similar to Tsimshian are Czech (94.4%, a difference of 0.0%), Tlingit-Haida (94.4%, a difference of 0.010%), Italian (94.5%, a difference of 0.020%), English (94.4%, a difference of 0.030%), and Irish (94.4%, a difference of 0.050%).
| Demographics | Rating | Rank | 11th Grade |
| Bulgarians | 100.0 /100 | #15 | Exceptional 94.5% |
| Immigrants | India | 100.0 /100 | #16 | Exceptional 94.5% |
| Luxembourgers | 100.0 /100 | #17 | Exceptional 94.5% |
| Maltese | 100.0 /100 | #18 | Exceptional 94.5% |
| Scandinavians | 100.0 /100 | #19 | Exceptional 94.5% |
| Italians | 100.0 /100 | #20 | Exceptional 94.5% |
| Tlingit-Haida | 100.0 /100 | #21 | Exceptional 94.4% |
| Tsimshian | 100.0 /100 | #22 | Exceptional 94.4% |
| Czechs | 100.0 /100 | #23 | Exceptional 94.4% |
| English | 100.0 /100 | #24 | Exceptional 94.4% |
| Irish | 100.0 /100 | #25 | Exceptional 94.4% |
| Scottish | 100.0 /100 | #26 | Exceptional 94.4% |
| Europeans | 100.0 /100 | #27 | Exceptional 94.4% |
| Estonians | 100.0 /100 | #28 | Exceptional 94.4% |
| Dutch | 100.0 /100 | #29 | Exceptional 94.3% |