Vietnamese vs Tsimshian 11th Grade
COMPARE
Vietnamese
Tsimshian
11th Grade
11th Grade Comparison
Vietnamese
Tsimshian
89.4%
11TH GRADE
0.0/ 100
METRIC RATING
311th/ 347
METRIC RANK
94.4%
11TH GRADE
100.0/ 100
METRIC RATING
22nd/ 347
METRIC RANK
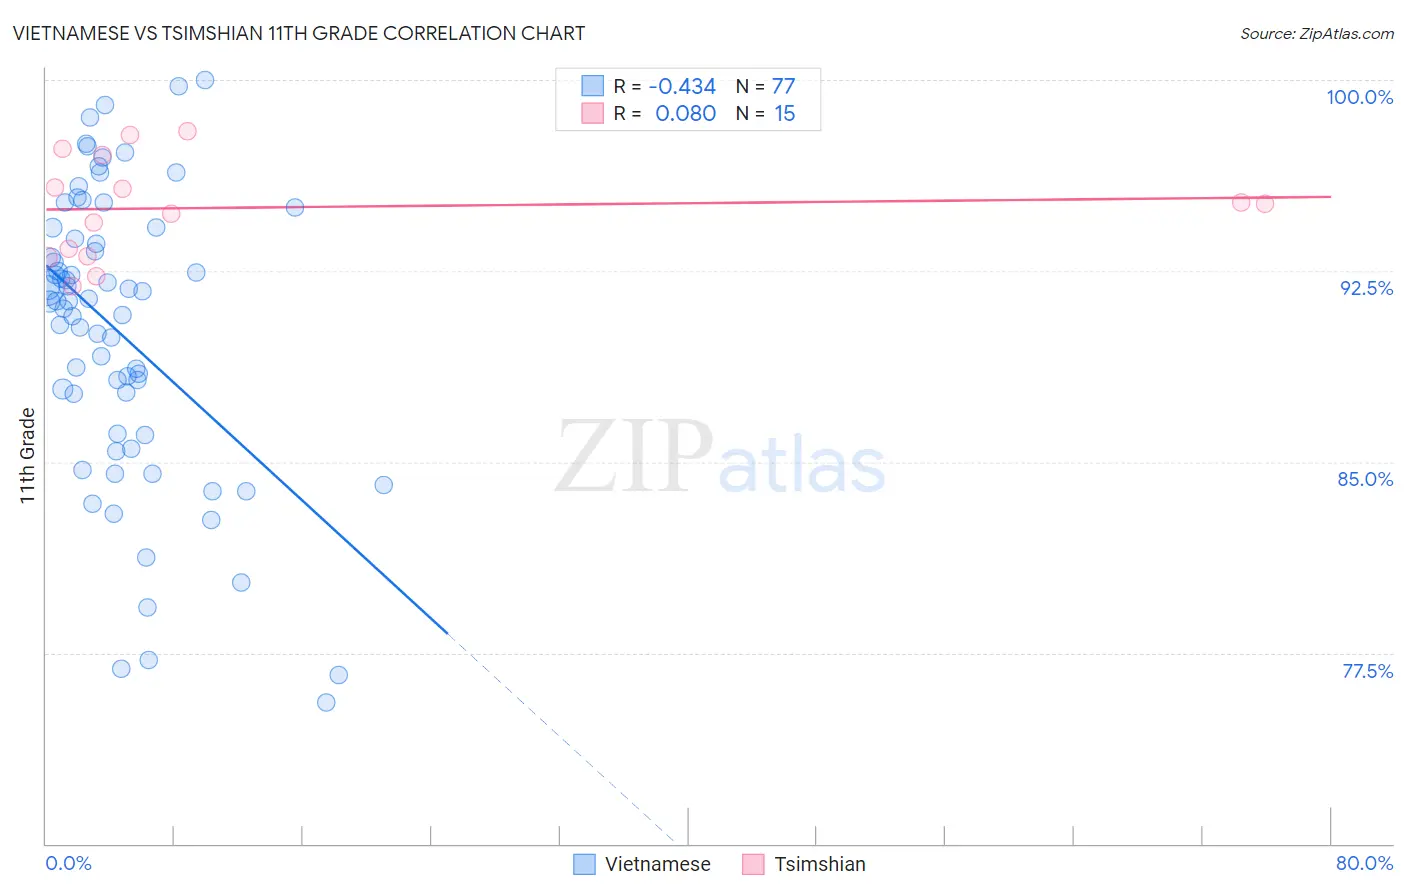
Vietnamese vs Tsimshian 11th Grade Correlation Chart
The statistical analysis conducted on geographies consisting of 170,728,240 people shows a moderate negative correlation between the proportion of Vietnamese and percentage of population with at least 11th grade education in the United States with a correlation coefficient (R) of -0.434 and weighted average of 89.4%. Similarly, the statistical analysis conducted on geographies consisting of 15,626,544 people shows a slight positive correlation between the proportion of Tsimshian and percentage of population with at least 11th grade education in the United States with a correlation coefficient (R) of 0.080 and weighted average of 94.4%, a difference of 5.6%.
11th Grade Correlation Summary
| Measurement | Vietnamese | Tsimshian |
| Minimum | 75.6% | 91.9% |
| Maximum | 100.0% | 98.0% |
| Range | 24.4% | 6.1% |
| Mean | 90.0% | 95.0% |
| Median | 91.3% | 95.1% |
| Interquartile 25% (IQ1) | 86.1% | 93.1% |
| Interquartile 75% (IQ3) | 94.0% | 97.0% |
| Interquartile Range (IQR) | 7.9% | 4.0% |
| Standard Deviation (Sample) | 5.7% | 2.0% |
| Standard Deviation (Population) | 5.7% | 1.9% |
Similar Demographics by 11th Grade
Demographics Similar to Vietnamese by 11th Grade
In terms of 11th grade, the demographic groups most similar to Vietnamese are Yaqui (89.5%, a difference of 0.060%), Immigrants from Bangladesh (89.5%, a difference of 0.080%), Nepalese (89.5%, a difference of 0.10%), Immigrants from Dominica (89.5%, a difference of 0.12%), and Ecuadorian (89.6%, a difference of 0.17%).
| Demographics | Rating | Rank | 11th Grade |
| Yuman | 0.0 /100 | #304 | Tragic 89.7% |
| Immigrants | Cambodia | 0.0 /100 | #305 | Tragic 89.6% |
| Ecuadorians | 0.0 /100 | #306 | Tragic 89.6% |
| Immigrants | Dominica | 0.0 /100 | #307 | Tragic 89.5% |
| Nepalese | 0.0 /100 | #308 | Tragic 89.5% |
| Immigrants | Bangladesh | 0.0 /100 | #309 | Tragic 89.5% |
| Yaqui | 0.0 /100 | #310 | Tragic 89.5% |
| Vietnamese | 0.0 /100 | #311 | Tragic 89.4% |
| Immigrants | Portugal | 0.0 /100 | #312 | Tragic 89.3% |
| Immigrants | Caribbean | 0.0 /100 | #313 | Tragic 89.1% |
| Cape Verdeans | 0.0 /100 | #314 | Tragic 89.1% |
| Immigrants | Ecuador | 0.0 /100 | #315 | Tragic 89.1% |
| Immigrants | Cuba | 0.0 /100 | #316 | Tragic 88.9% |
| Lumbee | 0.0 /100 | #317 | Tragic 88.9% |
| Nicaraguans | 0.0 /100 | #318 | Tragic 88.9% |
Demographics Similar to Tsimshian by 11th Grade
In terms of 11th grade, the demographic groups most similar to Tsimshian are Czech (94.4%, a difference of 0.0%), Tlingit-Haida (94.4%, a difference of 0.010%), Italian (94.5%, a difference of 0.020%), English (94.4%, a difference of 0.030%), and Irish (94.4%, a difference of 0.050%).
| Demographics | Rating | Rank | 11th Grade |
| Bulgarians | 100.0 /100 | #15 | Exceptional 94.5% |
| Immigrants | India | 100.0 /100 | #16 | Exceptional 94.5% |
| Luxembourgers | 100.0 /100 | #17 | Exceptional 94.5% |
| Maltese | 100.0 /100 | #18 | Exceptional 94.5% |
| Scandinavians | 100.0 /100 | #19 | Exceptional 94.5% |
| Italians | 100.0 /100 | #20 | Exceptional 94.5% |
| Tlingit-Haida | 100.0 /100 | #21 | Exceptional 94.4% |
| Tsimshian | 100.0 /100 | #22 | Exceptional 94.4% |
| Czechs | 100.0 /100 | #23 | Exceptional 94.4% |
| English | 100.0 /100 | #24 | Exceptional 94.4% |
| Irish | 100.0 /100 | #25 | Exceptional 94.4% |
| Scottish | 100.0 /100 | #26 | Exceptional 94.4% |
| Europeans | 100.0 /100 | #27 | Exceptional 94.4% |
| Estonians | 100.0 /100 | #28 | Exceptional 94.4% |
| Dutch | 100.0 /100 | #29 | Exceptional 94.3% |