Scotch-Irish vs Tsimshian Family Households with Children
COMPARE
Scotch-Irish
Tsimshian
Family Households with Children
Family Households with Children Comparison
Scotch-Irish
Tsimshian
26.8%
FAMILY HOUSEHOLDS WITH CHILDREN
1.4/ 100
METRIC RATING
256th/ 347
METRIC RANK
27.0%
FAMILY HOUSEHOLDS WITH CHILDREN
6.6/ 100
METRIC RATING
227th/ 347
METRIC RANK
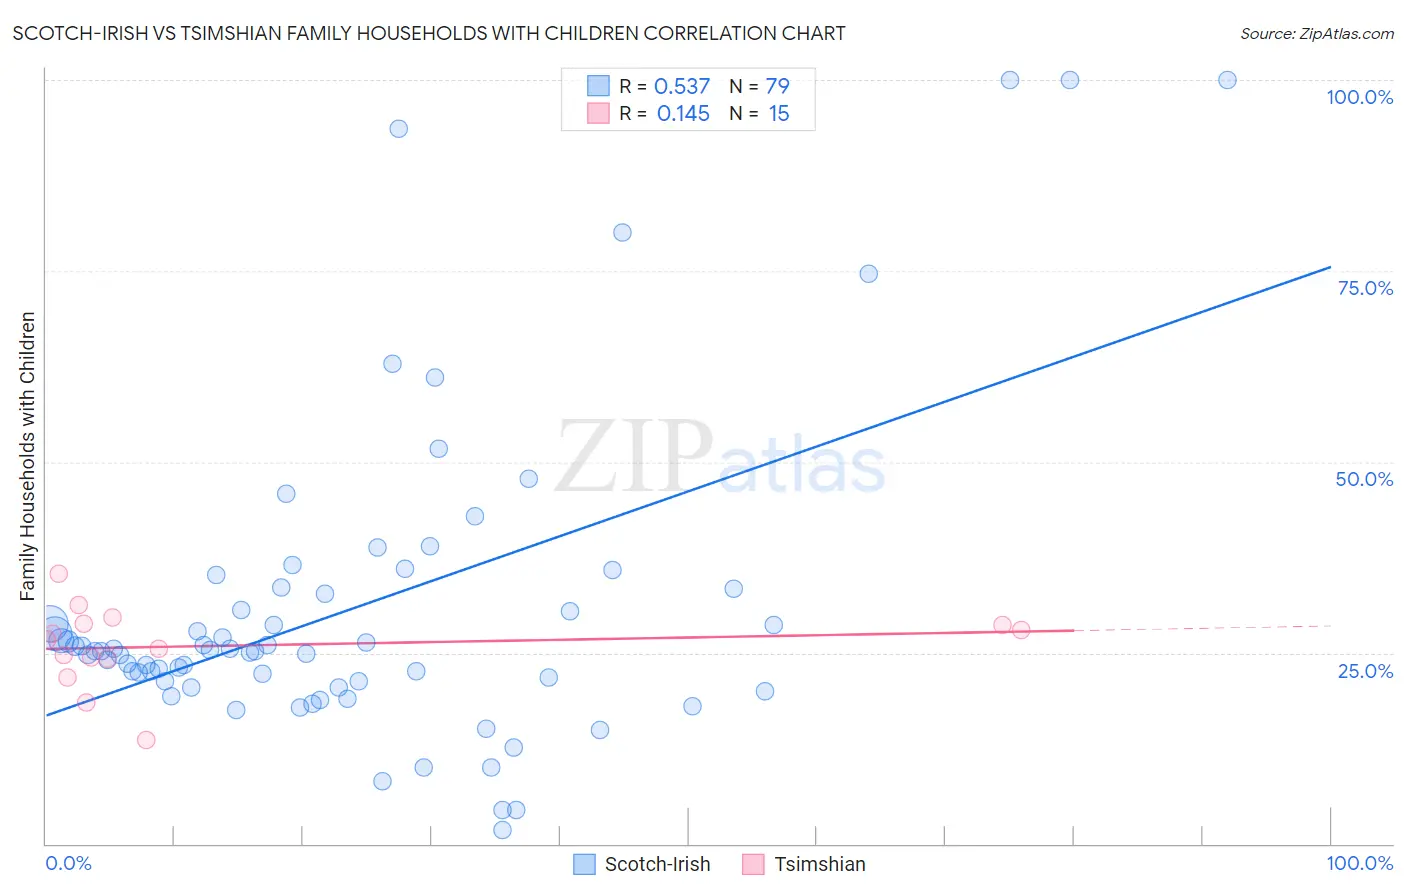
Scotch-Irish vs Tsimshian Family Households with Children Correlation Chart
The statistical analysis conducted on geographies consisting of 548,065,437 people shows a substantial positive correlation between the proportion of Scotch-Irish and percentage of family households with children in the United States with a correlation coefficient (R) of 0.537 and weighted average of 26.8%. Similarly, the statistical analysis conducted on geographies consisting of 15,626,544 people shows a poor positive correlation between the proportion of Tsimshian and percentage of family households with children in the United States with a correlation coefficient (R) of 0.145 and weighted average of 27.0%, a difference of 0.89%.
Family Households with Children Correlation Summary
| Measurement | Scotch-Irish | Tsimshian |
| Minimum | 1.9% | 13.6% |
| Maximum | 100.0% | 35.4% |
| Range | 98.1% | 21.9% |
| Mean | 30.8% | 25.9% |
| Median | 25.3% | 26.6% |
| Interquartile 25% (IQ1) | 21.2% | 24.2% |
| Interquartile 75% (IQ3) | 33.3% | 28.8% |
| Interquartile Range (IQR) | 12.1% | 4.6% |
| Standard Deviation (Sample) | 20.6% | 5.2% |
| Standard Deviation (Population) | 20.5% | 5.1% |
Similar Demographics by Family Households with Children
Demographics Similar to Scotch-Irish by Family Households with Children
In terms of family households with children, the demographic groups most similar to Scotch-Irish are German Russian (26.8%, a difference of 0.010%), Immigrants from Scotland (26.8%, a difference of 0.020%), Italian (26.8%, a difference of 0.050%), Slavic (26.8%, a difference of 0.050%), and Immigrants from Cuba (26.8%, a difference of 0.050%).
| Demographics | Rating | Rank | Family Households with Children |
| Immigrants | Eastern Europe | 2.1 /100 | #249 | Tragic 26.9% |
| Belgians | 2.1 /100 | #250 | Tragic 26.9% |
| Immigrants | Bosnia and Herzegovina | 1.9 /100 | #251 | Tragic 26.8% |
| Irish | 1.8 /100 | #252 | Tragic 26.8% |
| Italians | 1.5 /100 | #253 | Tragic 26.8% |
| Immigrants | Scotland | 1.5 /100 | #254 | Tragic 26.8% |
| German Russians | 1.5 /100 | #255 | Tragic 26.8% |
| Scotch-Irish | 1.4 /100 | #256 | Tragic 26.8% |
| Slavs | 1.3 /100 | #257 | Tragic 26.8% |
| Immigrants | Cuba | 1.3 /100 | #258 | Tragic 26.8% |
| Immigrants | Lithuania | 1.2 /100 | #259 | Tragic 26.8% |
| Immigrants | Jamaica | 1.2 /100 | #260 | Tragic 26.8% |
| Immigrants | Belarus | 1.1 /100 | #261 | Tragic 26.8% |
| Immigrants | Russia | 1.0 /100 | #262 | Tragic 26.8% |
| Immigrants | North Macedonia | 1.0 /100 | #263 | Tragic 26.7% |
Demographics Similar to Tsimshian by Family Households with Children
In terms of family households with children, the demographic groups most similar to Tsimshian are Czechoslovakian (27.0%, a difference of 0.0%), Scottish (27.0%, a difference of 0.0%), Immigrants from Caribbean (27.0%, a difference of 0.030%), Canadian (27.1%, a difference of 0.080%), and Bulgarian (27.0%, a difference of 0.080%).
| Demographics | Rating | Rank | Family Households with Children |
| Austrians | 9.9 /100 | #220 | Tragic 27.1% |
| New Zealanders | 9.6 /100 | #221 | Tragic 27.1% |
| Paraguayans | 9.4 /100 | #222 | Tragic 27.1% |
| Pima | 9.2 /100 | #223 | Tragic 27.1% |
| Germans | 8.7 /100 | #224 | Tragic 27.1% |
| Canadians | 7.5 /100 | #225 | Tragic 27.1% |
| Czechoslovakians | 6.6 /100 | #226 | Tragic 27.0% |
| Tsimshian | 6.6 /100 | #227 | Tragic 27.0% |
| Scottish | 6.5 /100 | #228 | Tragic 27.0% |
| Immigrants | Caribbean | 6.3 /100 | #229 | Tragic 27.0% |
| Bulgarians | 5.8 /100 | #230 | Tragic 27.0% |
| Luxembourgers | 5.5 /100 | #231 | Tragic 27.0% |
| Yugoslavians | 5.1 /100 | #232 | Tragic 27.0% |
| Immigrants | Italy | 5.0 /100 | #233 | Tragic 27.0% |
| Immigrants | Germany | 4.4 /100 | #234 | Tragic 27.0% |