Spanish American vs Subsaharan African Professional Degree
COMPARE
Spanish American
Subsaharan African
Professional Degree
Professional Degree Comparison
Spanish Americans
Sub-Saharan Africans
3.9%
PROFESSIONAL DEGREE
3.8/ 100
METRIC RATING
236th/ 347
METRIC RANK
4.1%
PROFESSIONAL DEGREE
12.8/ 100
METRIC RATING
207th/ 347
METRIC RANK
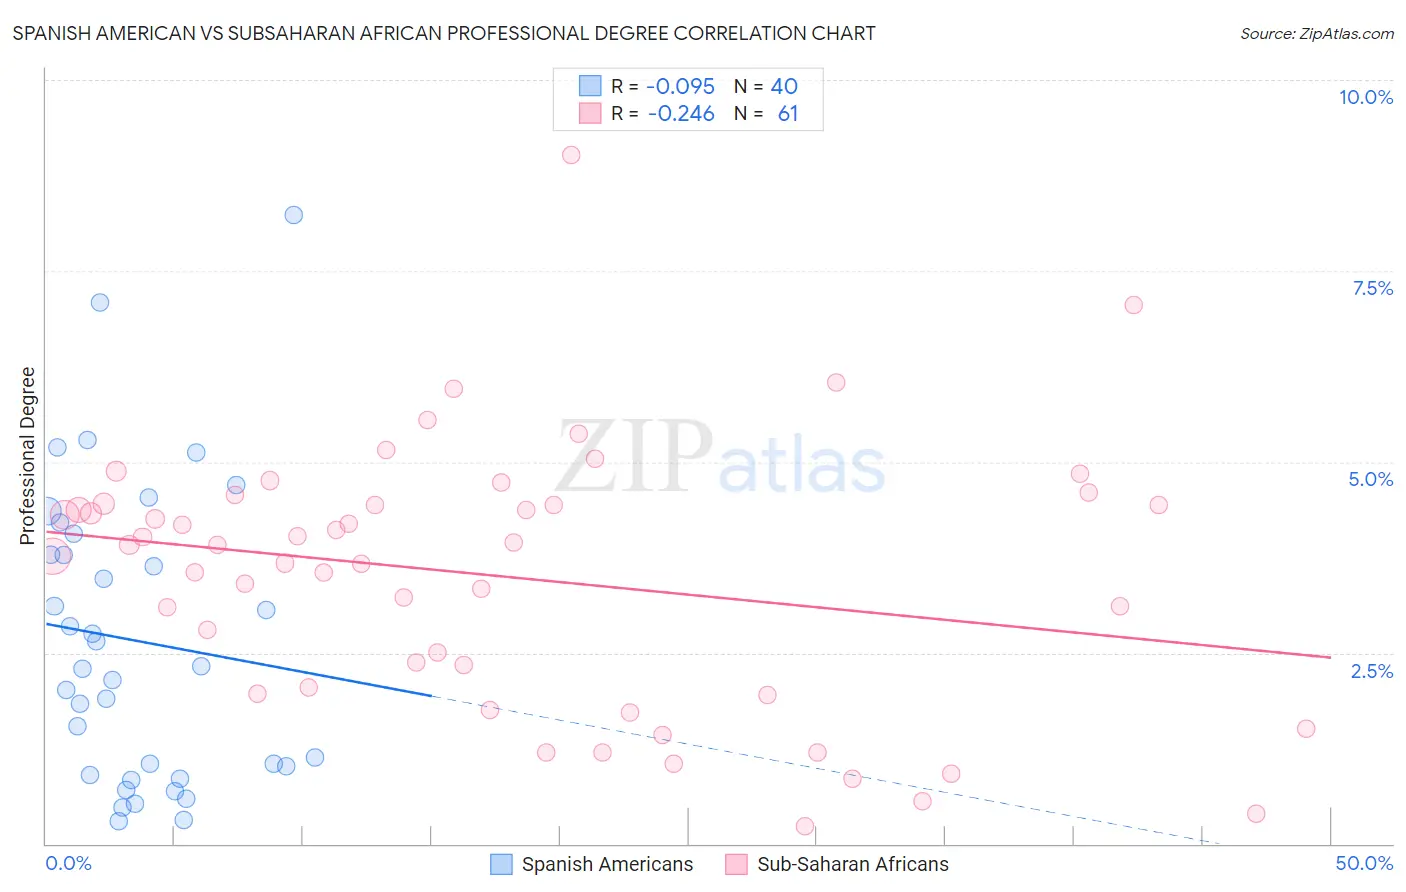
Spanish American vs Subsaharan African Professional Degree Correlation Chart
The statistical analysis conducted on geographies consisting of 103,063,360 people shows a slight negative correlation between the proportion of Spanish Americans and percentage of population with at least professional degree education in the United States with a correlation coefficient (R) of -0.095 and weighted average of 3.9%. Similarly, the statistical analysis conducted on geographies consisting of 505,148,465 people shows a weak negative correlation between the proportion of Sub-Saharan Africans and percentage of population with at least professional degree education in the United States with a correlation coefficient (R) of -0.246 and weighted average of 4.1%, a difference of 5.3%.
Professional Degree Correlation Summary
| Measurement | Spanish American | Subsaharan African |
| Minimum | 0.30% | 0.23% |
| Maximum | 8.2% | 9.0% |
| Range | 7.9% | 8.8% |
| Mean | 2.7% | 3.5% |
| Median | 2.3% | 3.9% |
| Interquartile 25% (IQ1) | 0.95% | 2.0% |
| Interquartile 75% (IQ3) | 3.9% | 4.4% |
| Interquartile Range (IQR) | 3.0% | 2.4% |
| Standard Deviation (Sample) | 1.9% | 1.7% |
| Standard Deviation (Population) | 1.9% | 1.7% |
Similar Demographics by Professional Degree
Demographics Similar to Spanish Americans by Professional Degree
In terms of professional degree, the demographic groups most similar to Spanish Americans are Immigrants from Trinidad and Tobago (3.9%, a difference of 0.070%), Immigrants from Barbados (3.9%, a difference of 0.22%), Nonimmigrants (3.9%, a difference of 0.23%), Immigrants from Philippines (3.9%, a difference of 0.28%), and Cree (3.9%, a difference of 0.53%).
| Demographics | Rating | Rank | Professional Degree |
| Immigrants | Burma/Myanmar | 5.4 /100 | #229 | Tragic 3.9% |
| Nicaraguans | 5.1 /100 | #230 | Tragic 3.9% |
| Ecuadorians | 4.6 /100 | #231 | Tragic 3.9% |
| Cree | 4.3 /100 | #232 | Tragic 3.9% |
| Immigrants | Philippines | 4.1 /100 | #233 | Tragic 3.9% |
| Immigrants | Nonimmigrants | 4.0 /100 | #234 | Tragic 3.9% |
| Immigrants | Barbados | 4.0 /100 | #235 | Tragic 3.9% |
| Spanish Americans | 3.8 /100 | #236 | Tragic 3.9% |
| Immigrants | Trinidad and Tobago | 3.8 /100 | #237 | Tragic 3.9% |
| Colville | 2.6 /100 | #238 | Tragic 3.8% |
| British West Indians | 2.4 /100 | #239 | Tragic 3.8% |
| Immigrants | Ecuador | 2.3 /100 | #240 | Tragic 3.8% |
| Alaskan Athabascans | 2.3 /100 | #241 | Tragic 3.8% |
| Native Hawaiians | 2.3 /100 | #242 | Tragic 3.8% |
| Guamanians/Chamorros | 2.2 /100 | #243 | Tragic 3.8% |
Demographics Similar to Sub-Saharan Africans by Professional Degree
In terms of professional degree, the demographic groups most similar to Sub-Saharan Africans are Immigrants from Somalia (4.1%, a difference of 0.080%), Immigrants from Panama (4.1%, a difference of 0.16%), Yugoslavian (4.1%, a difference of 0.24%), Immigrants from Nigeria (4.1%, a difference of 0.38%), and German (4.1%, a difference of 0.42%).
| Demographics | Rating | Rank | Professional Degree |
| Immigrants | North Macedonia | 20.2 /100 | #200 | Fair 4.2% |
| Finns | 18.7 /100 | #201 | Poor 4.2% |
| Immigrants | Iraq | 17.1 /100 | #202 | Poor 4.2% |
| Panamanians | 15.9 /100 | #203 | Poor 4.1% |
| Barbadians | 15.8 /100 | #204 | Poor 4.1% |
| Somalis | 14.8 /100 | #205 | Poor 4.1% |
| Yugoslavians | 13.4 /100 | #206 | Poor 4.1% |
| Sub-Saharan Africans | 12.8 /100 | #207 | Poor 4.1% |
| Immigrants | Somalia | 12.5 /100 | #208 | Poor 4.1% |
| Immigrants | Panama | 12.3 /100 | #209 | Poor 4.1% |
| Immigrants | Nigeria | 11.7 /100 | #210 | Poor 4.1% |
| Germans | 11.6 /100 | #211 | Poor 4.1% |
| Whites/Caucasians | 11.2 /100 | #212 | Poor 4.1% |
| Koreans | 10.7 /100 | #213 | Poor 4.1% |
| Immigrants | Ghana | 10.6 /100 | #214 | Poor 4.1% |