Scotch-Irish vs Houma Professional Degree
COMPARE
Scotch-Irish
Houma
Professional Degree
Professional Degree Comparison
Scotch-Irish
Houma
4.3%
PROFESSIONAL DEGREE
34.2/ 100
METRIC RATING
186th/ 347
METRIC RANK
2.2%
PROFESSIONAL DEGREE
0.0/ 100
METRIC RATING
347th/ 347
METRIC RANK
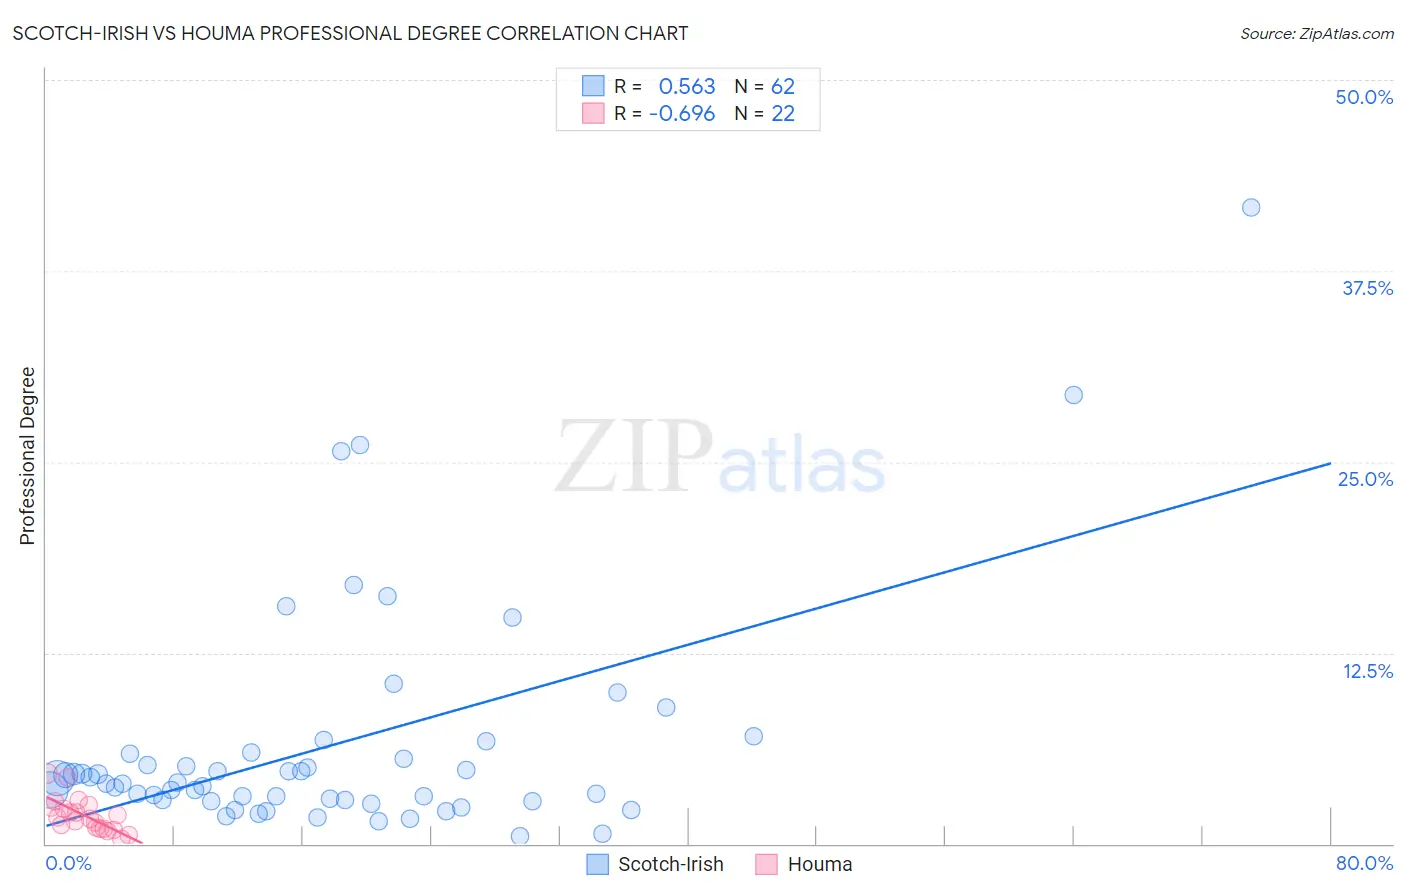
Scotch-Irish vs Houma Professional Degree Correlation Chart
The statistical analysis conducted on geographies consisting of 542,187,635 people shows a substantial positive correlation between the proportion of Scotch-Irish and percentage of population with at least professional degree education in the United States with a correlation coefficient (R) of 0.563 and weighted average of 4.3%. Similarly, the statistical analysis conducted on geographies consisting of 36,689,629 people shows a significant negative correlation between the proportion of Houma and percentage of population with at least professional degree education in the United States with a correlation coefficient (R) of -0.696 and weighted average of 2.2%, a difference of 94.1%.
Professional Degree Correlation Summary
| Measurement | Scotch-Irish | Houma |
| Minimum | 0.53% | 0.35% |
| Maximum | 41.7% | 4.6% |
| Range | 41.1% | 4.3% |
| Mean | 6.5% | 1.9% |
| Median | 4.0% | 1.7% |
| Interquartile 25% (IQ1) | 2.8% | 1.0% |
| Interquartile 75% (IQ3) | 5.9% | 2.4% |
| Interquartile Range (IQR) | 3.0% | 1.4% |
| Standard Deviation (Sample) | 7.5% | 1.1% |
| Standard Deviation (Population) | 7.4% | 1.1% |
Similar Demographics by Professional Degree
Demographics Similar to Scotch-Irish by Professional Degree
In terms of professional degree, the demographic groups most similar to Scotch-Irish are Immigrants from Cameroon (4.3%, a difference of 0.15%), Welsh (4.3%, a difference of 0.27%), Belgian (4.3%, a difference of 0.32%), Immigrants from Thailand (4.3%, a difference of 0.43%), and Slovak (4.3%, a difference of 0.60%).
| Demographics | Rating | Rank | Professional Degree |
| Immigrants | Kenya | 45.9 /100 | #179 | Average 4.4% |
| Czechs | 44.9 /100 | #180 | Average 4.4% |
| Danes | 43.5 /100 | #181 | Average 4.4% |
| Immigrants | Immigrants | 43.2 /100 | #182 | Average 4.4% |
| Bermudans | 43.1 /100 | #183 | Average 4.4% |
| Belgians | 36.2 /100 | #184 | Fair 4.3% |
| Welsh | 35.8 /100 | #185 | Fair 4.3% |
| Scotch-Irish | 34.2 /100 | #186 | Fair 4.3% |
| Immigrants | Cameroon | 33.3 /100 | #187 | Fair 4.3% |
| Immigrants | Thailand | 31.7 /100 | #188 | Fair 4.3% |
| Slovaks | 30.7 /100 | #189 | Fair 4.3% |
| Immigrants | Poland | 29.2 /100 | #190 | Fair 4.3% |
| Sri Lankans | 29.0 /100 | #191 | Fair 4.3% |
| Ghanaians | 27.3 /100 | #192 | Fair 4.3% |
| French | 27.1 /100 | #193 | Fair 4.2% |
Demographics Similar to Houma by Professional Degree
In terms of professional degree, the demographic groups most similar to Houma are Lumbee (2.5%, a difference of 11.1%), Immigrants from Mexico (2.6%, a difference of 19.3%), Spanish American Indian (2.7%, a difference of 19.7%), Mexican (2.7%, a difference of 24.0%), and Immigrants from the Azores (2.8%, a difference of 27.6%).
| Demographics | Rating | Rank | Professional Degree |
| Puget Sound Salish | 0.0 /100 | #333 | Tragic 3.1% |
| Pennsylvania Germans | 0.0 /100 | #334 | Tragic 3.0% |
| Natives/Alaskans | 0.0 /100 | #335 | Tragic 3.0% |
| Fijians | 0.0 /100 | #336 | Tragic 2.9% |
| Arapaho | 0.0 /100 | #337 | Tragic 2.9% |
| Navajo | 0.0 /100 | #338 | Tragic 2.9% |
| Immigrants | Central America | 0.0 /100 | #339 | Tragic 2.9% |
| Yup'ik | 0.0 /100 | #340 | Tragic 2.9% |
| Tohono O'odham | 0.0 /100 | #341 | Tragic 2.8% |
| Immigrants | Azores | 0.0 /100 | #342 | Tragic 2.8% |
| Mexicans | 0.0 /100 | #343 | Tragic 2.7% |
| Spanish American Indians | 0.0 /100 | #344 | Tragic 2.7% |
| Immigrants | Mexico | 0.0 /100 | #345 | Tragic 2.6% |
| Lumbee | 0.0 /100 | #346 | Tragic 2.5% |
| Houma | 0.0 /100 | #347 | Tragic 2.2% |