Dominican vs Immigrants from Congo 11th Grade
COMPARE
Dominican
Immigrants from Congo
11th Grade
11th Grade Comparison
Dominicans
Immigrants from Congo
87.7%
11TH GRADE
0.0/ 100
METRIC RATING
326th/ 347
METRIC RANK
90.9%
11TH GRADE
0.1/ 100
METRIC RATING
277th/ 347
METRIC RANK
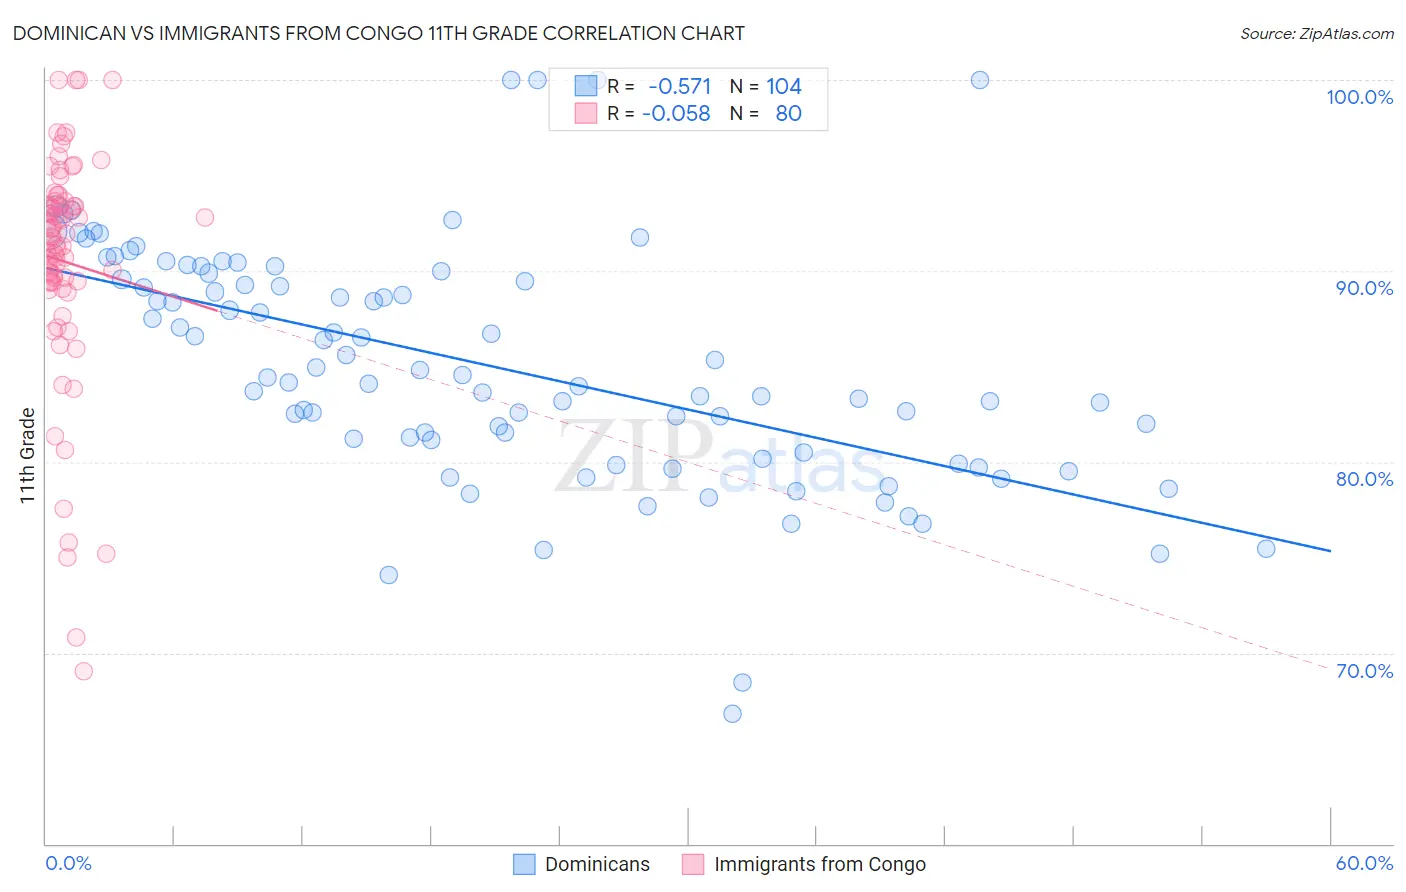
Dominican vs Immigrants from Congo 11th Grade Correlation Chart
The statistical analysis conducted on geographies consisting of 355,142,452 people shows a substantial negative correlation between the proportion of Dominicans and percentage of population with at least 11th grade education in the United States with a correlation coefficient (R) of -0.571 and weighted average of 87.7%. Similarly, the statistical analysis conducted on geographies consisting of 92,134,351 people shows a slight negative correlation between the proportion of Immigrants from Congo and percentage of population with at least 11th grade education in the United States with a correlation coefficient (R) of -0.058 and weighted average of 90.9%, a difference of 3.6%.
11th Grade Correlation Summary
| Measurement | Dominican | Immigrants from Congo |
| Minimum | 66.8% | 69.1% |
| Maximum | 100.0% | 100.0% |
| Range | 33.2% | 30.9% |
| Mean | 85.1% | 90.5% |
| Median | 84.5% | 91.6% |
| Interquartile 25% (IQ1) | 80.8% | 89.4% |
| Interquartile 75% (IQ3) | 89.7% | 93.5% |
| Interquartile Range (IQR) | 8.9% | 4.1% |
| Standard Deviation (Sample) | 6.2% | 6.1% |
| Standard Deviation (Population) | 6.2% | 6.1% |
Similar Demographics by 11th Grade
Demographics Similar to Dominicans by 11th Grade
In terms of 11th grade, the demographic groups most similar to Dominicans are Immigrants from Cabo Verde (87.6%, a difference of 0.020%), Tohono O'odham (87.6%, a difference of 0.080%), Mexican American Indian (87.5%, a difference of 0.15%), Honduran (87.4%, a difference of 0.34%), and Hispanic or Latino (87.3%, a difference of 0.40%).
| Demographics | Rating | Rank | 11th Grade |
| Belizeans | 0.0 /100 | #319 | Tragic 88.8% |
| Immigrants | Armenia | 0.0 /100 | #320 | Tragic 88.8% |
| Immigrants | Belize | 0.0 /100 | #321 | Tragic 88.7% |
| Puerto Ricans | 0.0 /100 | #322 | Tragic 88.4% |
| Pima | 0.0 /100 | #323 | Tragic 88.3% |
| Central American Indians | 0.0 /100 | #324 | Tragic 88.2% |
| Immigrants | Nicaragua | 0.0 /100 | #325 | Tragic 88.1% |
| Dominicans | 0.0 /100 | #326 | Tragic 87.7% |
| Immigrants | Cabo Verde | 0.0 /100 | #327 | Tragic 87.6% |
| Tohono O'odham | 0.0 /100 | #328 | Tragic 87.6% |
| Mexican American Indians | 0.0 /100 | #329 | Tragic 87.5% |
| Hondurans | 0.0 /100 | #330 | Tragic 87.4% |
| Hispanics or Latinos | 0.0 /100 | #331 | Tragic 87.3% |
| Immigrants | Azores | 0.0 /100 | #332 | Tragic 87.2% |
| Immigrants | Yemen | 0.0 /100 | #333 | Tragic 87.1% |
Demographics Similar to Immigrants from Congo by 11th Grade
In terms of 11th grade, the demographic groups most similar to Immigrants from Congo are Bangladeshi (90.9%, a difference of 0.020%), Malaysian (90.8%, a difference of 0.040%), Barbadian (90.8%, a difference of 0.080%), Immigrants from South Eastern Asia (90.9%, a difference of 0.090%), and Immigrants from Trinidad and Tobago (90.9%, a difference of 0.10%).
| Demographics | Rating | Rank | 11th Grade |
| Trinidadians and Tobagonians | 0.2 /100 | #270 | Tragic 91.1% |
| Immigrants | Peru | 0.1 /100 | #271 | Tragic 91.0% |
| West Indians | 0.1 /100 | #272 | Tragic 91.0% |
| Paiute | 0.1 /100 | #273 | Tragic 91.0% |
| Immigrants | Trinidad and Tobago | 0.1 /100 | #274 | Tragic 90.9% |
| Immigrants | South Eastern Asia | 0.1 /100 | #275 | Tragic 90.9% |
| Bangladeshis | 0.1 /100 | #276 | Tragic 90.9% |
| Immigrants | Congo | 0.1 /100 | #277 | Tragic 90.9% |
| Malaysians | 0.1 /100 | #278 | Tragic 90.8% |
| Barbadians | 0.0 /100 | #279 | Tragic 90.8% |
| Sri Lankans | 0.0 /100 | #280 | Tragic 90.7% |
| Dutch West Indians | 0.0 /100 | #281 | Tragic 90.7% |
| Immigrants | St. Vincent and the Grenadines | 0.0 /100 | #282 | Tragic 90.7% |
| Immigrants | Barbados | 0.0 /100 | #283 | Tragic 90.7% |
| Immigrants | Laos | 0.0 /100 | #284 | Tragic 90.5% |