Immigrants from Colombia vs Immigrants from Congo 11th Grade
COMPARE
Immigrants from Colombia
Immigrants from Congo
11th Grade
11th Grade Comparison
Immigrants from Colombia
Immigrants from Congo
91.4%
11TH GRADE
0.6/ 100
METRIC RATING
258th/ 347
METRIC RANK
90.9%
11TH GRADE
0.1/ 100
METRIC RATING
277th/ 347
METRIC RANK
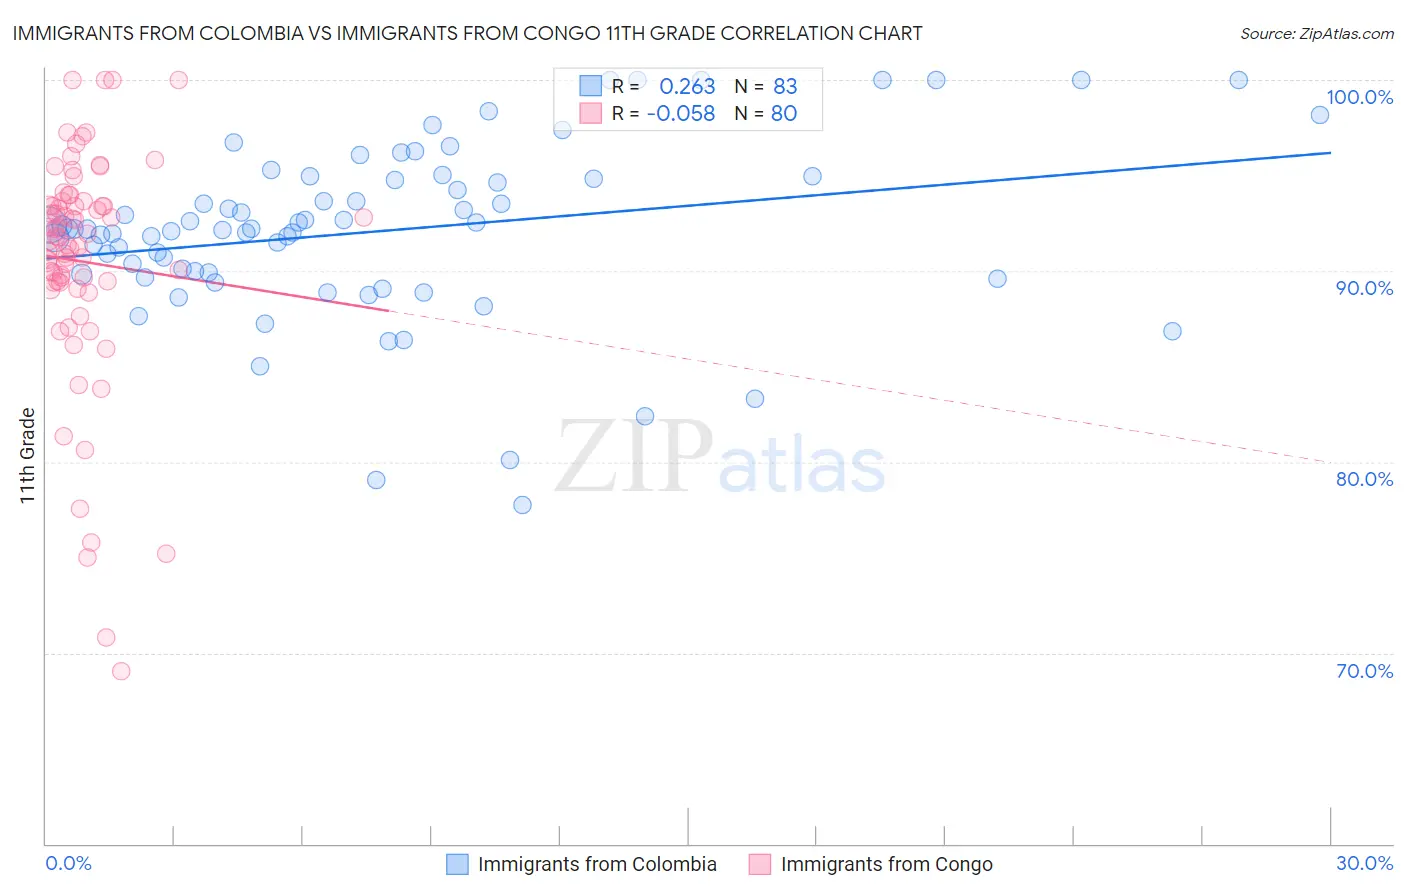
Immigrants from Colombia vs Immigrants from Congo 11th Grade Correlation Chart
The statistical analysis conducted on geographies consisting of 378,643,826 people shows a weak positive correlation between the proportion of Immigrants from Colombia and percentage of population with at least 11th grade education in the United States with a correlation coefficient (R) of 0.263 and weighted average of 91.4%. Similarly, the statistical analysis conducted on geographies consisting of 92,134,351 people shows a slight negative correlation between the proportion of Immigrants from Congo and percentage of population with at least 11th grade education in the United States with a correlation coefficient (R) of -0.058 and weighted average of 90.9%, a difference of 0.57%.
11th Grade Correlation Summary
| Measurement | Immigrants from Colombia | Immigrants from Congo |
| Minimum | 77.8% | 69.1% |
| Maximum | 100.0% | 100.0% |
| Range | 22.2% | 30.9% |
| Mean | 92.1% | 90.5% |
| Median | 92.2% | 91.6% |
| Interquartile 25% (IQ1) | 89.8% | 89.4% |
| Interquartile 75% (IQ3) | 94.8% | 93.5% |
| Interquartile Range (IQR) | 5.0% | 4.1% |
| Standard Deviation (Sample) | 4.6% | 6.1% |
| Standard Deviation (Population) | 4.6% | 6.1% |
Demographics Similar to Immigrants from Colombia and Immigrants from Congo by 11th Grade
In terms of 11th grade, the demographic groups most similar to Immigrants from Colombia are Jamaican (91.4%, a difference of 0.010%), Cajun (91.4%, a difference of 0.020%), Spanish American (91.4%, a difference of 0.020%), Taiwanese (91.3%, a difference of 0.030%), and Immigrants from Uruguay (91.3%, a difference of 0.040%). Similarly, the demographic groups most similar to Immigrants from Congo are Bangladeshi (90.9%, a difference of 0.020%), Immigrants from South Eastern Asia (90.9%, a difference of 0.090%), Immigrants from Trinidad and Tobago (90.9%, a difference of 0.10%), Paiute (91.0%, a difference of 0.14%), and Immigrants from Peru (91.0%, a difference of 0.19%).
| Demographics | Rating | Rank | 11th Grade |
| Cajuns | 0.7 /100 | #257 | Tragic 91.4% |
| Immigrants | Colombia | 0.6 /100 | #258 | Tragic 91.4% |
| Jamaicans | 0.6 /100 | #259 | Tragic 91.4% |
| Spanish Americans | 0.6 /100 | #260 | Tragic 91.4% |
| Taiwanese | 0.6 /100 | #261 | Tragic 91.3% |
| Immigrants | Uruguay | 0.5 /100 | #262 | Tragic 91.3% |
| Immigrants | Ghana | 0.3 /100 | #263 | Tragic 91.2% |
| Yup'ik | 0.3 /100 | #264 | Tragic 91.2% |
| Pueblo | 0.3 /100 | #265 | Tragic 91.2% |
| Immigrants | Western Africa | 0.3 /100 | #266 | Tragic 91.2% |
| Immigrants | Jamaica | 0.3 /100 | #267 | Tragic 91.2% |
| U.S. Virgin Islanders | 0.2 /100 | #268 | Tragic 91.1% |
| Ute | 0.2 /100 | #269 | Tragic 91.1% |
| Trinidadians and Tobagonians | 0.2 /100 | #270 | Tragic 91.1% |
| Immigrants | Peru | 0.1 /100 | #271 | Tragic 91.0% |
| West Indians | 0.1 /100 | #272 | Tragic 91.0% |
| Paiute | 0.1 /100 | #273 | Tragic 91.0% |
| Immigrants | Trinidad and Tobago | 0.1 /100 | #274 | Tragic 90.9% |
| Immigrants | South Eastern Asia | 0.1 /100 | #275 | Tragic 90.9% |
| Bangladeshis | 0.1 /100 | #276 | Tragic 90.9% |
| Immigrants | Congo | 0.1 /100 | #277 | Tragic 90.9% |