Immigrants from the Azores vs Immigrants from Congo 11th Grade
COMPARE
Immigrants from the Azores
Immigrants from Congo
11th Grade
11th Grade Comparison
Immigrants from the Azores
Immigrants from Congo
87.2%
11TH GRADE
0.0/ 100
METRIC RATING
332nd/ 347
METRIC RANK
90.9%
11TH GRADE
0.1/ 100
METRIC RATING
277th/ 347
METRIC RANK
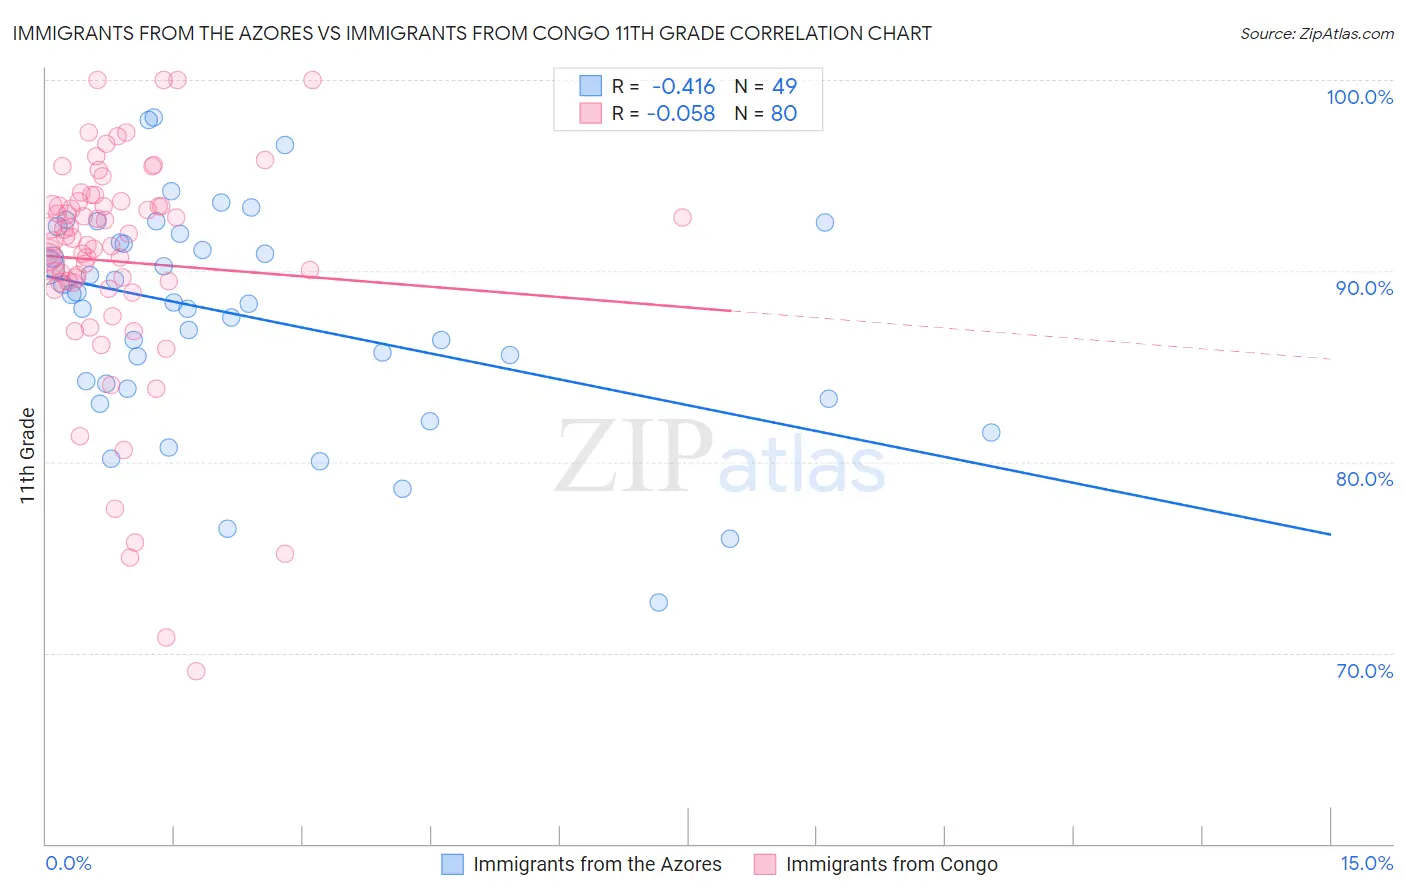
Immigrants from the Azores vs Immigrants from Congo 11th Grade Correlation Chart
The statistical analysis conducted on geographies consisting of 46,257,310 people shows a moderate negative correlation between the proportion of Immigrants from the Azores and percentage of population with at least 11th grade education in the United States with a correlation coefficient (R) of -0.416 and weighted average of 87.2%. Similarly, the statistical analysis conducted on geographies consisting of 92,134,351 people shows a slight negative correlation between the proportion of Immigrants from Congo and percentage of population with at least 11th grade education in the United States with a correlation coefficient (R) of -0.058 and weighted average of 90.9%, a difference of 4.2%.
11th Grade Correlation Summary
| Measurement | Immigrants from the Azores | Immigrants from Congo |
| Minimum | 72.6% | 69.1% |
| Maximum | 98.0% | 100.0% |
| Range | 25.4% | 30.9% |
| Mean | 87.6% | 90.5% |
| Median | 88.3% | 91.6% |
| Interquartile 25% (IQ1) | 83.9% | 89.4% |
| Interquartile 75% (IQ3) | 91.7% | 93.5% |
| Interquartile Range (IQR) | 7.8% | 4.1% |
| Standard Deviation (Sample) | 5.6% | 6.1% |
| Standard Deviation (Population) | 5.6% | 6.1% |
Similar Demographics by 11th Grade
Demographics Similar to Immigrants from the Azores by 11th Grade
In terms of 11th grade, the demographic groups most similar to Immigrants from the Azores are Hispanic or Latino (87.3%, a difference of 0.090%), Honduran (87.4%, a difference of 0.16%), Immigrants from Yemen (87.1%, a difference of 0.17%), Houma (87.0%, a difference of 0.24%), and Central American (86.9%, a difference of 0.33%).
| Demographics | Rating | Rank | 11th Grade |
| Immigrants | Nicaragua | 0.0 /100 | #325 | Tragic 88.1% |
| Dominicans | 0.0 /100 | #326 | Tragic 87.7% |
| Immigrants | Cabo Verde | 0.0 /100 | #327 | Tragic 87.6% |
| Tohono O'odham | 0.0 /100 | #328 | Tragic 87.6% |
| Mexican American Indians | 0.0 /100 | #329 | Tragic 87.5% |
| Hondurans | 0.0 /100 | #330 | Tragic 87.4% |
| Hispanics or Latinos | 0.0 /100 | #331 | Tragic 87.3% |
| Immigrants | Azores | 0.0 /100 | #332 | Tragic 87.2% |
| Immigrants | Yemen | 0.0 /100 | #333 | Tragic 87.1% |
| Houma | 0.0 /100 | #334 | Tragic 87.0% |
| Central Americans | 0.0 /100 | #335 | Tragic 86.9% |
| Immigrants | Dominican Republic | 0.0 /100 | #336 | Tragic 86.9% |
| Immigrants | Honduras | 0.0 /100 | #337 | Tragic 86.9% |
| Immigrants | Latin America | 0.0 /100 | #338 | Tragic 86.8% |
| Guatemalans | 0.0 /100 | #339 | Tragic 86.4% |
Demographics Similar to Immigrants from Congo by 11th Grade
In terms of 11th grade, the demographic groups most similar to Immigrants from Congo are Bangladeshi (90.9%, a difference of 0.020%), Malaysian (90.8%, a difference of 0.040%), Barbadian (90.8%, a difference of 0.080%), Immigrants from South Eastern Asia (90.9%, a difference of 0.090%), and Immigrants from Trinidad and Tobago (90.9%, a difference of 0.10%).
| Demographics | Rating | Rank | 11th Grade |
| Trinidadians and Tobagonians | 0.2 /100 | #270 | Tragic 91.1% |
| Immigrants | Peru | 0.1 /100 | #271 | Tragic 91.0% |
| West Indians | 0.1 /100 | #272 | Tragic 91.0% |
| Paiute | 0.1 /100 | #273 | Tragic 91.0% |
| Immigrants | Trinidad and Tobago | 0.1 /100 | #274 | Tragic 90.9% |
| Immigrants | South Eastern Asia | 0.1 /100 | #275 | Tragic 90.9% |
| Bangladeshis | 0.1 /100 | #276 | Tragic 90.9% |
| Immigrants | Congo | 0.1 /100 | #277 | Tragic 90.9% |
| Malaysians | 0.1 /100 | #278 | Tragic 90.8% |
| Barbadians | 0.0 /100 | #279 | Tragic 90.8% |
| Sri Lankans | 0.0 /100 | #280 | Tragic 90.7% |
| Dutch West Indians | 0.0 /100 | #281 | Tragic 90.7% |
| Immigrants | St. Vincent and the Grenadines | 0.0 /100 | #282 | Tragic 90.7% |
| Immigrants | Barbados | 0.0 /100 | #283 | Tragic 90.7% |
| Immigrants | Laos | 0.0 /100 | #284 | Tragic 90.5% |