Immigrants from Bolivia vs Alaskan Athabascan GED/Equivalency
COMPARE
Immigrants from Bolivia
Alaskan Athabascan
GED/Equivalency
GED/Equivalency Comparison
Immigrants from Bolivia
Alaskan Athabascans
85.8%
GED/EQUIVALENCY
49.8/ 100
METRIC RATING
175th/ 347
METRIC RANK
85.3%
GED/EQUIVALENCY
27.5/ 100
METRIC RATING
190th/ 347
METRIC RANK
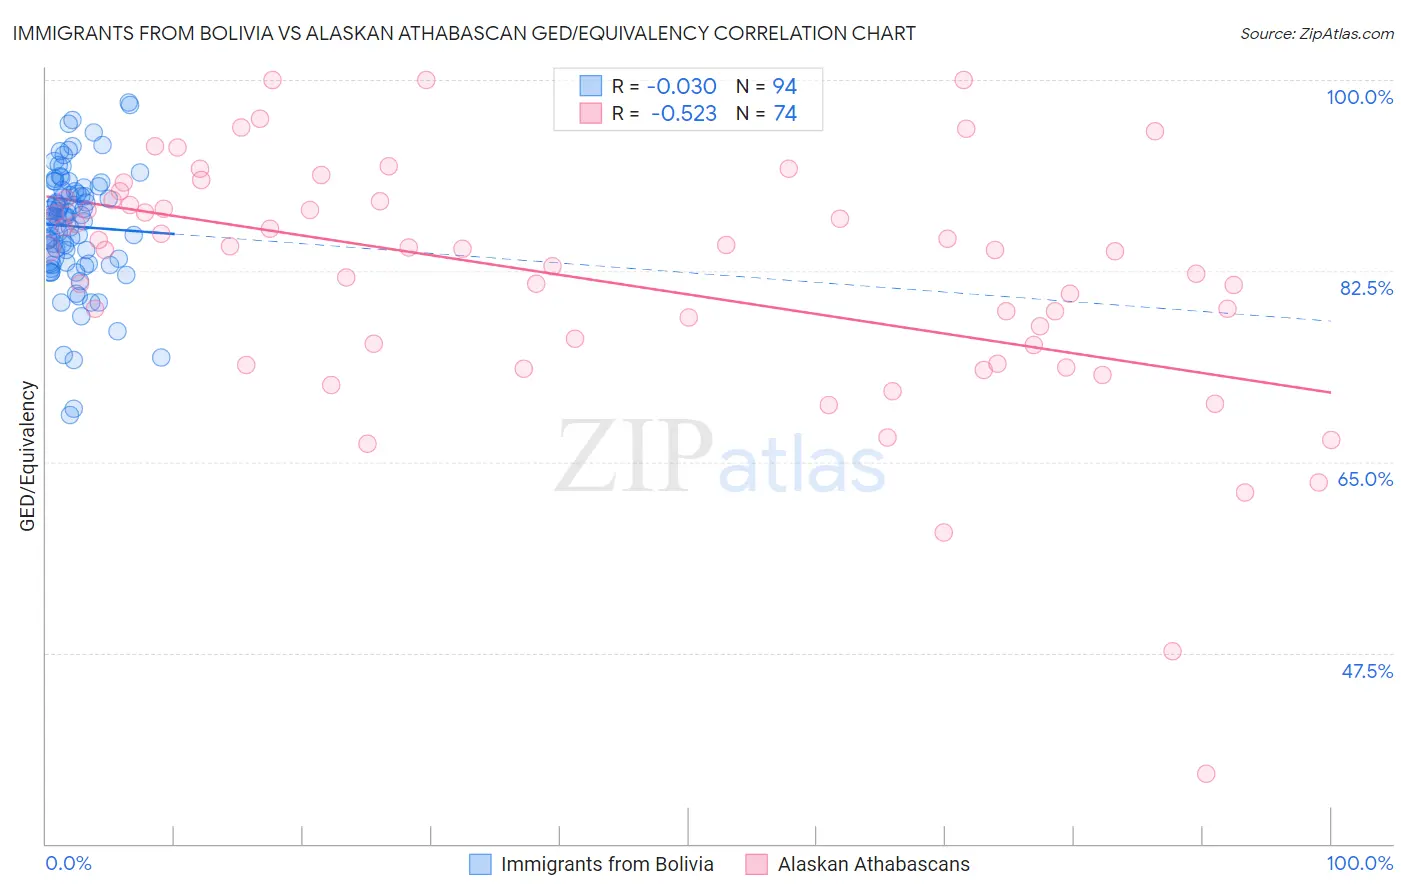
Immigrants from Bolivia vs Alaskan Athabascan GED/Equivalency Correlation Chart
The statistical analysis conducted on geographies consisting of 158,730,894 people shows no correlation between the proportion of Immigrants from Bolivia and percentage of population with at least ged/equivalency education in the United States with a correlation coefficient (R) of -0.030 and weighted average of 85.8%. Similarly, the statistical analysis conducted on geographies consisting of 45,820,221 people shows a substantial negative correlation between the proportion of Alaskan Athabascans and percentage of population with at least ged/equivalency education in the United States with a correlation coefficient (R) of -0.523 and weighted average of 85.3%, a difference of 0.50%.
GED/Equivalency Correlation Summary
| Measurement | Immigrants from Bolivia | Alaskan Athabascan |
| Minimum | 69.3% | 36.4% |
| Maximum | 98.0% | 100.0% |
| Range | 28.7% | 63.6% |
| Mean | 86.6% | 81.7% |
| Median | 87.5% | 84.5% |
| Interquartile 25% (IQ1) | 83.3% | 75.7% |
| Interquartile 75% (IQ3) | 90.0% | 88.9% |
| Interquartile Range (IQR) | 6.7% | 13.2% |
| Standard Deviation (Sample) | 5.5% | 11.4% |
| Standard Deviation (Population) | 5.4% | 11.3% |
Demographics Similar to Immigrants from Bolivia and Alaskan Athabascans by GED/Equivalency
In terms of ged/equivalency, the demographic groups most similar to Immigrants from Bolivia are Ottawa (85.8%, a difference of 0.0%), Immigrants from Venezuela (85.8%, a difference of 0.020%), Immigrants from Eastern Africa (85.7%, a difference of 0.040%), Immigrants from Uganda (85.7%, a difference of 0.10%), and Bermudan (85.8%, a difference of 0.11%). Similarly, the demographic groups most similar to Alaskan Athabascans are Guamanian/Chamorro (85.3%, a difference of 0.020%), Immigrants from Sierra Leone (85.4%, a difference of 0.040%), Immigrants from Afghanistan (85.4%, a difference of 0.060%), Spaniard (85.4%, a difference of 0.11%), and Spanish (85.4%, a difference of 0.13%).
| Demographics | Rating | Rank | GED/Equivalency |
| Bermudans | 55.1 /100 | #172 | Average 85.8% |
| Immigrants | Venezuela | 50.7 /100 | #173 | Average 85.8% |
| Ottawa | 50.0 /100 | #174 | Average 85.8% |
| Immigrants | Bolivia | 49.8 /100 | #175 | Average 85.8% |
| Immigrants | Eastern Africa | 47.7 /100 | #176 | Average 85.7% |
| Immigrants | Uganda | 45.2 /100 | #177 | Average 85.7% |
| Koreans | 41.2 /100 | #178 | Average 85.6% |
| Aleuts | 40.5 /100 | #179 | Average 85.6% |
| Immigrants | Southern Europe | 38.4 /100 | #180 | Fair 85.5% |
| Moroccans | 37.7 /100 | #181 | Fair 85.5% |
| Sudanese | 35.2 /100 | #182 | Fair 85.5% |
| Immigrants | Sudan | 34.2 /100 | #183 | Fair 85.5% |
| Immigrants | Oceania | 33.6 /100 | #184 | Fair 85.5% |
| Spanish | 32.8 /100 | #185 | Fair 85.4% |
| Spaniards | 31.9 /100 | #186 | Fair 85.4% |
| Immigrants | Afghanistan | 29.8 /100 | #187 | Fair 85.4% |
| Immigrants | Sierra Leone | 29.0 /100 | #188 | Fair 85.4% |
| Guamanians/Chamorros | 28.4 /100 | #189 | Fair 85.3% |
| Alaskan Athabascans | 27.5 /100 | #190 | Fair 85.3% |
| South American Indians | 22.8 /100 | #191 | Fair 85.2% |
| Immigrants | Nonimmigrants | 22.7 /100 | #192 | Fair 85.2% |