Maltese vs Afghan No Schooling Completed
COMPARE
Maltese
Afghan
No Schooling Completed
No Schooling Completed Comparison
Maltese
Afghans
1.6%
NO SCHOOLING COMPLETED
99.9/ 100
METRIC RATING
46th/ 347
METRIC RANK
2.6%
NO SCHOOLING COMPLETED
0.1/ 100
METRIC RATING
281st/ 347
METRIC RANK
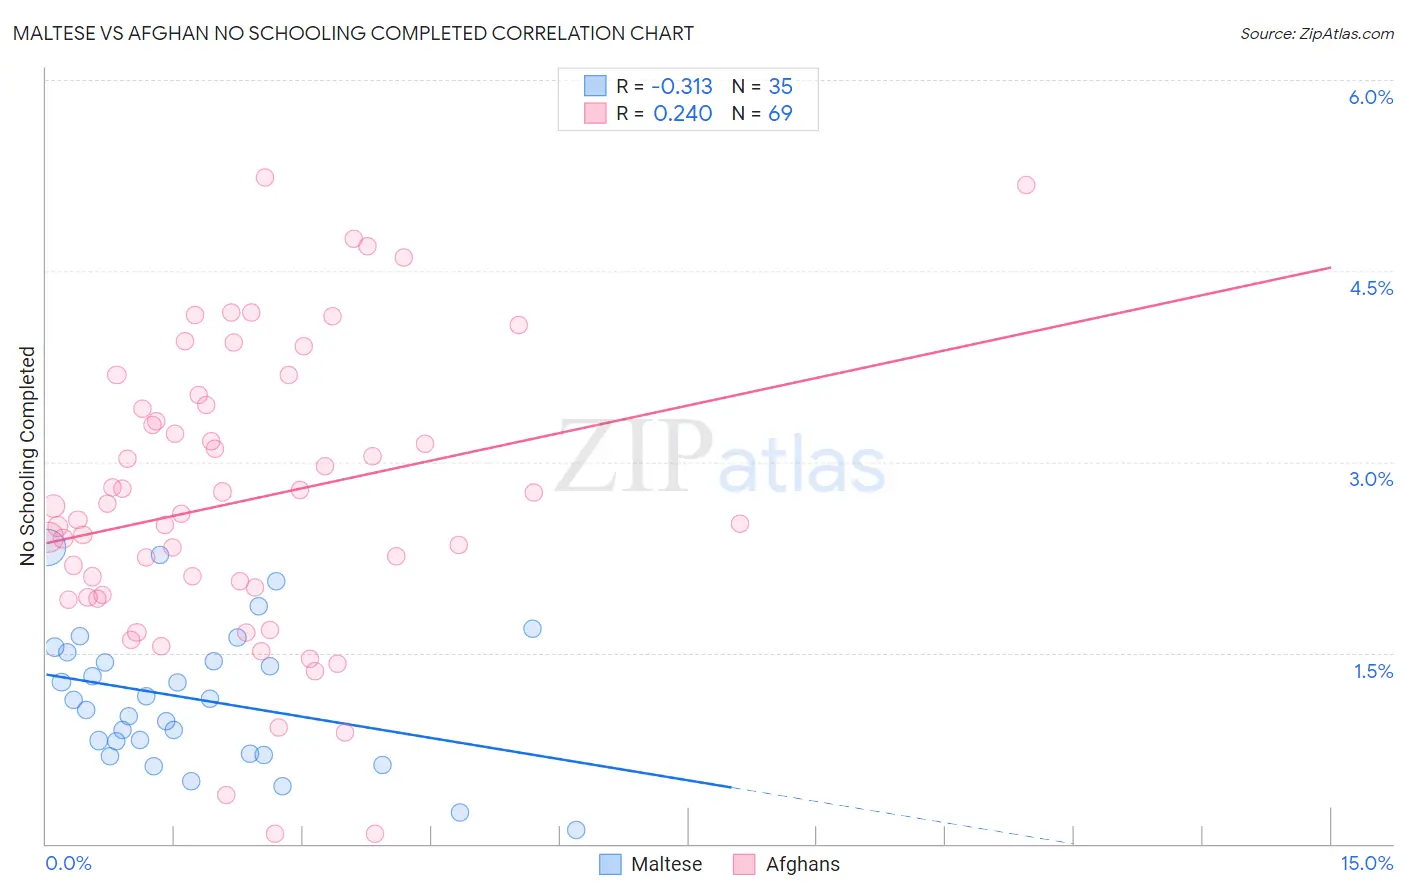
Maltese vs Afghan No Schooling Completed Correlation Chart
The statistical analysis conducted on geographies consisting of 126,020,620 people shows a mild negative correlation between the proportion of Maltese and percentage of population with no schooling in the United States with a correlation coefficient (R) of -0.313 and weighted average of 1.6%. Similarly, the statistical analysis conducted on geographies consisting of 148,452,178 people shows a weak positive correlation between the proportion of Afghans and percentage of population with no schooling in the United States with a correlation coefficient (R) of 0.240 and weighted average of 2.6%, a difference of 60.2%.
No Schooling Completed Correlation Summary
| Measurement | Maltese | Afghan |
| Minimum | 0.11% | 0.074% |
| Maximum | 2.3% | 5.2% |
| Range | 2.2% | 5.2% |
| Mean | 1.1% | 2.7% |
| Median | 1.1% | 2.6% |
| Interquartile 25% (IQ1) | 0.70% | 1.9% |
| Interquartile 75% (IQ3) | 1.5% | 3.4% |
| Interquartile Range (IQR) | 0.80% | 1.5% |
| Standard Deviation (Sample) | 0.54% | 1.1% |
| Standard Deviation (Population) | 0.53% | 1.1% |
Similar Demographics by No Schooling Completed
Demographics Similar to Maltese by No Schooling Completed
In terms of no schooling completed, the demographic groups most similar to Maltese are Czechoslovakian (1.6%, a difference of 0.090%), Estonian (1.6%, a difference of 0.13%), Ottawa (1.6%, a difference of 0.14%), Australian (1.6%, a difference of 0.32%), and Immigrants from Scotland (1.6%, a difference of 0.40%).
| Demographics | Rating | Rank | No Schooling Completed |
| Native Hawaiians | 99.9 /100 | #39 | Exceptional 1.6% |
| Luxembourgers | 99.9 /100 | #40 | Exceptional 1.6% |
| Hungarians | 99.9 /100 | #41 | Exceptional 1.6% |
| Bulgarians | 99.9 /100 | #42 | Exceptional 1.6% |
| Australians | 99.9 /100 | #43 | Exceptional 1.6% |
| Estonians | 99.9 /100 | #44 | Exceptional 1.6% |
| Czechoslovakians | 99.9 /100 | #45 | Exceptional 1.6% |
| Maltese | 99.9 /100 | #46 | Exceptional 1.6% |
| Ottawa | 99.9 /100 | #47 | Exceptional 1.6% |
| Immigrants | Scotland | 99.9 /100 | #48 | Exceptional 1.6% |
| Whites/Caucasians | 99.9 /100 | #49 | Exceptional 1.6% |
| Celtics | 99.9 /100 | #50 | Exceptional 1.6% |
| Chippewa | 99.8 /100 | #51 | Exceptional 1.6% |
| Immigrants | Canada | 99.8 /100 | #52 | Exceptional 1.6% |
| Creek | 99.8 /100 | #53 | Exceptional 1.6% |
Demographics Similar to Afghans by No Schooling Completed
In terms of no schooling completed, the demographic groups most similar to Afghans are Trinidadian and Tobagonian (2.6%, a difference of 0.080%), Barbadian (2.6%, a difference of 0.10%), Immigrants from Ghana (2.6%, a difference of 0.20%), Immigrants from Uzbekistan (2.6%, a difference of 0.64%), and Immigrants from Philippines (2.6%, a difference of 0.84%).
| Demographics | Rating | Rank | No Schooling Completed |
| Ghanaians | 0.1 /100 | #274 | Tragic 2.6% |
| Immigrants | China | 0.1 /100 | #275 | Tragic 2.6% |
| Immigrants | Western Africa | 0.1 /100 | #276 | Tragic 2.6% |
| Immigrants | Philippines | 0.1 /100 | #277 | Tragic 2.6% |
| Immigrants | Uzbekistan | 0.1 /100 | #278 | Tragic 2.6% |
| Barbadians | 0.1 /100 | #279 | Tragic 2.6% |
| Trinidadians and Tobagonians | 0.1 /100 | #280 | Tragic 2.6% |
| Afghans | 0.1 /100 | #281 | Tragic 2.6% |
| Immigrants | Ghana | 0.1 /100 | #282 | Tragic 2.6% |
| Immigrants | Trinidad and Tobago | 0.0 /100 | #283 | Tragic 2.6% |
| Immigrants | West Indies | 0.0 /100 | #284 | Tragic 2.7% |
| Immigrants | Barbados | 0.0 /100 | #285 | Tragic 2.7% |
| Immigrants | Portugal | 0.0 /100 | #286 | Tragic 2.7% |
| Immigrants | Afghanistan | 0.0 /100 | #287 | Tragic 2.7% |
| Immigrants | St. Vincent and the Grenadines | 0.0 /100 | #288 | Tragic 2.7% |