Chickasaw vs Afghan No Schooling Completed
COMPARE
Chickasaw
Afghan
No Schooling Completed
No Schooling Completed Comparison
Chickasaw
Afghans
1.7%
NO SCHOOLING COMPLETED
99.6/ 100
METRIC RATING
69th/ 347
METRIC RANK
2.6%
NO SCHOOLING COMPLETED
0.1/ 100
METRIC RATING
281st/ 347
METRIC RANK
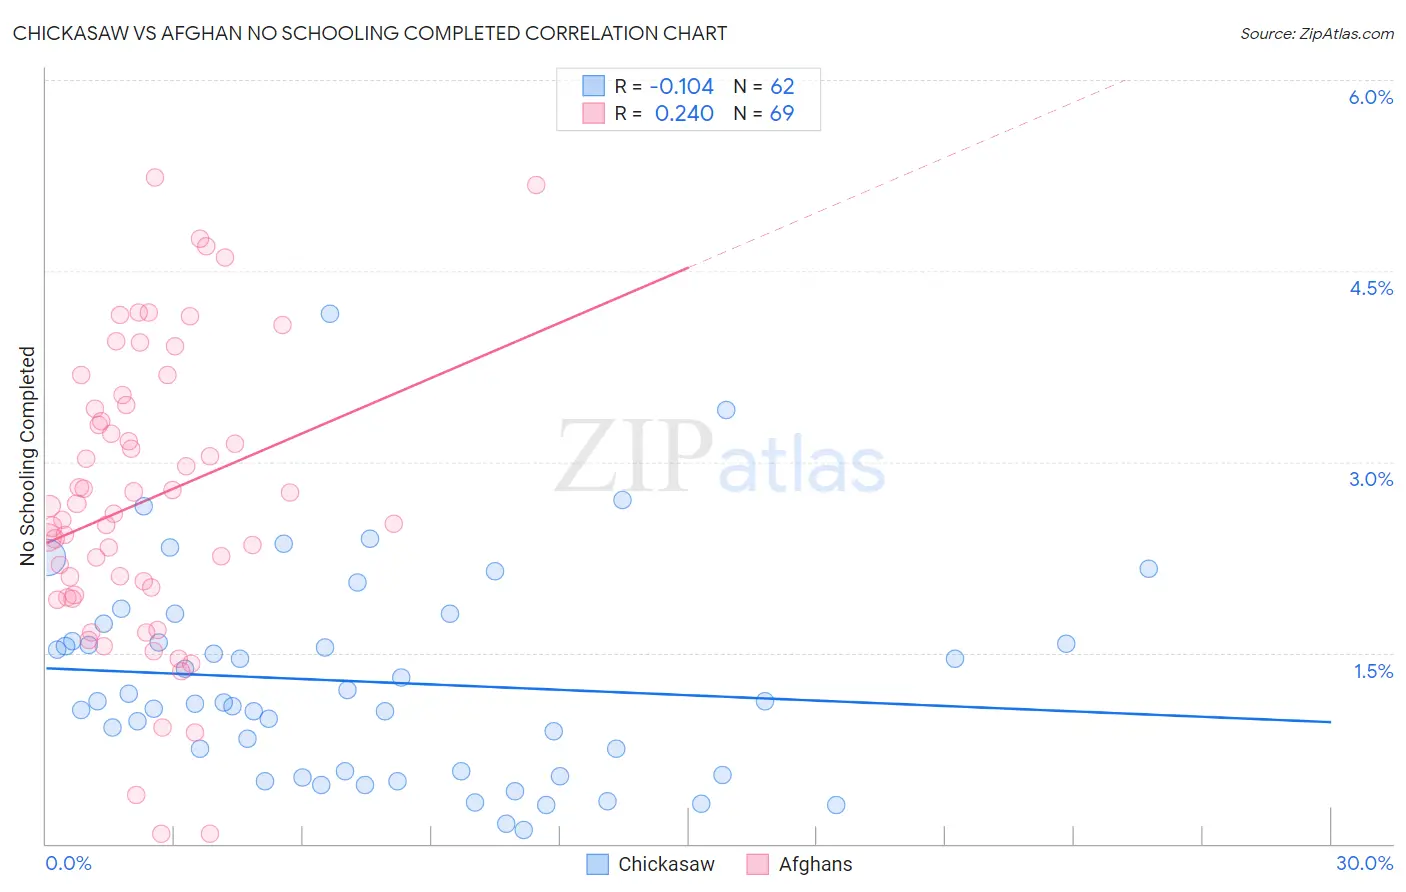
Chickasaw vs Afghan No Schooling Completed Correlation Chart
The statistical analysis conducted on geographies consisting of 146,942,262 people shows a poor negative correlation between the proportion of Chickasaw and percentage of population with no schooling in the United States with a correlation coefficient (R) of -0.104 and weighted average of 1.7%. Similarly, the statistical analysis conducted on geographies consisting of 148,452,178 people shows a weak positive correlation between the proportion of Afghans and percentage of population with no schooling in the United States with a correlation coefficient (R) of 0.240 and weighted average of 2.6%, a difference of 53.5%.
No Schooling Completed Correlation Summary
| Measurement | Chickasaw | Afghan |
| Minimum | 0.11% | 0.074% |
| Maximum | 4.2% | 5.2% |
| Range | 4.1% | 5.2% |
| Mean | 1.3% | 2.7% |
| Median | 1.1% | 2.6% |
| Interquartile 25% (IQ1) | 0.57% | 1.9% |
| Interquartile 75% (IQ3) | 1.6% | 3.4% |
| Interquartile Range (IQR) | 1.0% | 1.5% |
| Standard Deviation (Sample) | 0.81% | 1.1% |
| Standard Deviation (Population) | 0.80% | 1.1% |
Similar Demographics by No Schooling Completed
Demographics Similar to Chickasaw by No Schooling Completed
In terms of no schooling completed, the demographic groups most similar to Chickasaw are Immigrants from Lithuania (1.7%, a difference of 0.27%), Immigrants from Netherlands (1.7%, a difference of 0.97%), Immigrants from Austria (1.7%, a difference of 1.0%), Canadian (1.7%, a difference of 1.2%), and Immigrants from England (1.7%, a difference of 1.3%).
| Demographics | Rating | Rank | No Schooling Completed |
| Immigrants | Northern Europe | 99.8 /100 | #62 | Exceptional 1.7% |
| Russians | 99.8 /100 | #63 | Exceptional 1.7% |
| New Zealanders | 99.7 /100 | #64 | Exceptional 1.7% |
| Serbians | 99.7 /100 | #65 | Exceptional 1.7% |
| Canadians | 99.7 /100 | #66 | Exceptional 1.7% |
| Immigrants | Austria | 99.7 /100 | #67 | Exceptional 1.7% |
| Immigrants | Lithuania | 99.7 /100 | #68 | Exceptional 1.7% |
| Chickasaw | 99.6 /100 | #69 | Exceptional 1.7% |
| Immigrants | Netherlands | 99.6 /100 | #70 | Exceptional 1.7% |
| Immigrants | England | 99.5 /100 | #71 | Exceptional 1.7% |
| Cajuns | 99.5 /100 | #72 | Exceptional 1.7% |
| Immigrants | India | 99.4 /100 | #73 | Exceptional 1.7% |
| Zimbabweans | 99.4 /100 | #74 | Exceptional 1.7% |
| Immigrants | Belgium | 99.3 /100 | #75 | Exceptional 1.7% |
| Cherokee | 99.3 /100 | #76 | Exceptional 1.7% |
Demographics Similar to Afghans by No Schooling Completed
In terms of no schooling completed, the demographic groups most similar to Afghans are Trinidadian and Tobagonian (2.6%, a difference of 0.080%), Barbadian (2.6%, a difference of 0.10%), Immigrants from Ghana (2.6%, a difference of 0.20%), Immigrants from Uzbekistan (2.6%, a difference of 0.64%), and Immigrants from Philippines (2.6%, a difference of 0.84%).
| Demographics | Rating | Rank | No Schooling Completed |
| Ghanaians | 0.1 /100 | #274 | Tragic 2.6% |
| Immigrants | China | 0.1 /100 | #275 | Tragic 2.6% |
| Immigrants | Western Africa | 0.1 /100 | #276 | Tragic 2.6% |
| Immigrants | Philippines | 0.1 /100 | #277 | Tragic 2.6% |
| Immigrants | Uzbekistan | 0.1 /100 | #278 | Tragic 2.6% |
| Barbadians | 0.1 /100 | #279 | Tragic 2.6% |
| Trinidadians and Tobagonians | 0.1 /100 | #280 | Tragic 2.6% |
| Afghans | 0.1 /100 | #281 | Tragic 2.6% |
| Immigrants | Ghana | 0.1 /100 | #282 | Tragic 2.6% |
| Immigrants | Trinidad and Tobago | 0.0 /100 | #283 | Tragic 2.6% |
| Immigrants | West Indies | 0.0 /100 | #284 | Tragic 2.7% |
| Immigrants | Barbados | 0.0 /100 | #285 | Tragic 2.7% |
| Immigrants | Portugal | 0.0 /100 | #286 | Tragic 2.7% |
| Immigrants | Afghanistan | 0.0 /100 | #287 | Tragic 2.7% |
| Immigrants | St. Vincent and the Grenadines | 0.0 /100 | #288 | Tragic 2.7% |