Scotch-Irish vs Immigrants from Colombia No Schooling Completed
COMPARE
Scotch-Irish
Immigrants from Colombia
No Schooling Completed
No Schooling Completed Comparison
Scotch-Irish
Immigrants from Colombia
1.5%
NO SCHOOLING COMPLETED
100.0/ 100
METRIC RATING
14th/ 347
METRIC RANK
2.4%
NO SCHOOLING COMPLETED
1.0/ 100
METRIC RATING
252nd/ 347
METRIC RANK
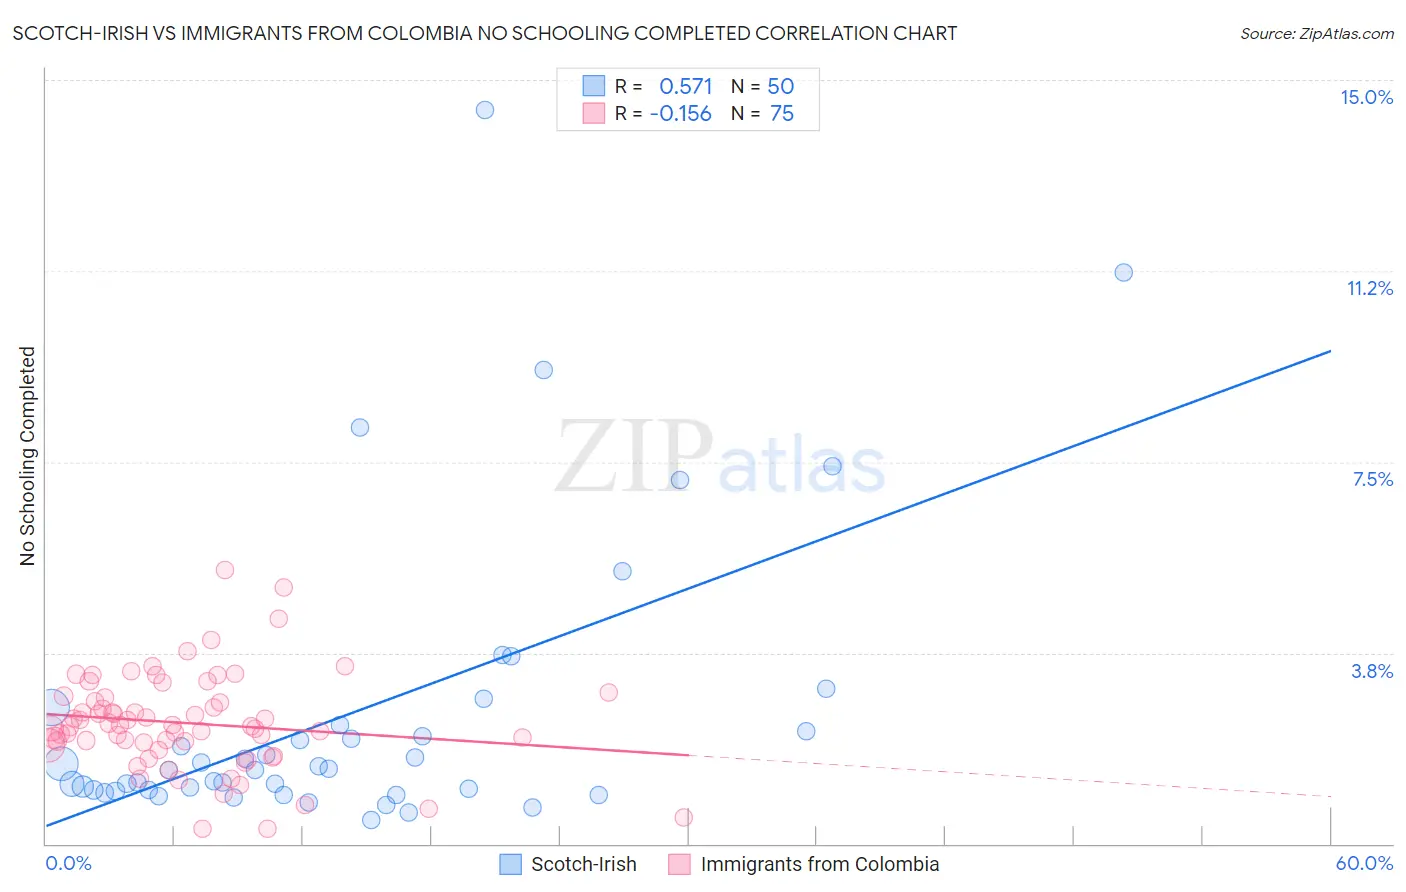
Scotch-Irish vs Immigrants from Colombia No Schooling Completed Correlation Chart
The statistical analysis conducted on geographies consisting of 532,641,930 people shows a substantial positive correlation between the proportion of Scotch-Irish and percentage of population with no schooling in the United States with a correlation coefficient (R) of 0.571 and weighted average of 1.5%. Similarly, the statistical analysis conducted on geographies consisting of 375,786,629 people shows a poor negative correlation between the proportion of Immigrants from Colombia and percentage of population with no schooling in the United States with a correlation coefficient (R) of -0.156 and weighted average of 2.4%, a difference of 66.5%.
No Schooling Completed Correlation Summary
| Measurement | Scotch-Irish | Immigrants from Colombia |
| Minimum | 0.46% | 0.30% |
| Maximum | 14.4% | 5.4% |
| Range | 14.0% | 5.1% |
| Mean | 2.6% | 2.4% |
| Median | 1.5% | 2.3% |
| Interquartile 25% (IQ1) | 1.0% | 1.9% |
| Interquartile 75% (IQ3) | 2.3% | 2.9% |
| Interquartile Range (IQR) | 1.3% | 0.94% |
| Standard Deviation (Sample) | 2.9% | 0.95% |
| Standard Deviation (Population) | 2.9% | 0.94% |
Similar Demographics by No Schooling Completed
Demographics Similar to Scotch-Irish by No Schooling Completed
In terms of no schooling completed, the demographic groups most similar to Scotch-Irish are Tlingit-Haida (1.5%, a difference of 0.060%), Finnish (1.5%, a difference of 0.58%), Croatian (1.5%, a difference of 0.59%), Danish (1.5%, a difference of 0.89%), and Polish (1.4%, a difference of 0.94%).
| Demographics | Rating | Rank | No Schooling Completed |
| English | 100.0 /100 | #7 | Exceptional 1.4% |
| Swedes | 100.0 /100 | #8 | Exceptional 1.4% |
| Scottish | 100.0 /100 | #9 | Exceptional 1.4% |
| Dutch | 100.0 /100 | #10 | Exceptional 1.4% |
| Lithuanians | 100.0 /100 | #11 | Exceptional 1.4% |
| Irish | 100.0 /100 | #12 | Exceptional 1.4% |
| Poles | 100.0 /100 | #13 | Exceptional 1.4% |
| Scotch-Irish | 100.0 /100 | #14 | Exceptional 1.5% |
| Tlingit-Haida | 100.0 /100 | #15 | Exceptional 1.5% |
| Finns | 100.0 /100 | #16 | Exceptional 1.5% |
| Croatians | 100.0 /100 | #17 | Exceptional 1.5% |
| Danes | 100.0 /100 | #18 | Exceptional 1.5% |
| Alaskan Athabascans | 100.0 /100 | #19 | Exceptional 1.5% |
| Welsh | 100.0 /100 | #20 | Exceptional 1.5% |
| Chinese | 100.0 /100 | #21 | Exceptional 1.5% |
Demographics Similar to Immigrants from Colombia by No Schooling Completed
In terms of no schooling completed, the demographic groups most similar to Immigrants from Colombia are Immigrants from Asia (2.4%, a difference of 0.13%), Immigrants from Eastern Africa (2.4%, a difference of 0.25%), Immigrants from Africa (2.4%, a difference of 0.45%), Ethiopian (2.4%, a difference of 0.45%), and Immigrants from Middle Africa (2.4%, a difference of 0.46%).
| Demographics | Rating | Rank | No Schooling Completed |
| Bolivians | 1.4 /100 | #245 | Tragic 2.4% |
| Immigrants | Congo | 1.4 /100 | #246 | Tragic 2.4% |
| Immigrants | Iraq | 1.3 /100 | #247 | Tragic 2.4% |
| Asians | 1.2 /100 | #248 | Tragic 2.4% |
| Jamaicans | 1.2 /100 | #249 | Tragic 2.4% |
| Immigrants | Middle Africa | 1.1 /100 | #250 | Tragic 2.4% |
| Immigrants | Africa | 1.1 /100 | #251 | Tragic 2.4% |
| Immigrants | Colombia | 1.0 /100 | #252 | Tragic 2.4% |
| Immigrants | Asia | 0.9 /100 | #253 | Tragic 2.4% |
| Immigrants | Eastern Africa | 0.9 /100 | #254 | Tragic 2.4% |
| Ethiopians | 0.8 /100 | #255 | Tragic 2.4% |
| Yaqui | 0.8 /100 | #256 | Tragic 2.4% |
| Immigrants | South America | 0.6 /100 | #257 | Tragic 2.5% |
| Assyrians/Chaldeans/Syriacs | 0.6 /100 | #258 | Tragic 2.5% |
| Immigrants | Jamaica | 0.6 /100 | #259 | Tragic 2.5% |