Immigrants from Honduras vs Somali Bachelor's Degree
COMPARE
Immigrants from Honduras
Somali
Bachelor's Degree
Bachelor's Degree Comparison
Immigrants from Honduras
Somalis
30.9%
BACHELOR'S DEGREE
0.1/ 100
METRIC RATING
290th/ 347
METRIC RANK
38.1%
BACHELOR'S DEGREE
58.6/ 100
METRIC RATING
166th/ 347
METRIC RANK
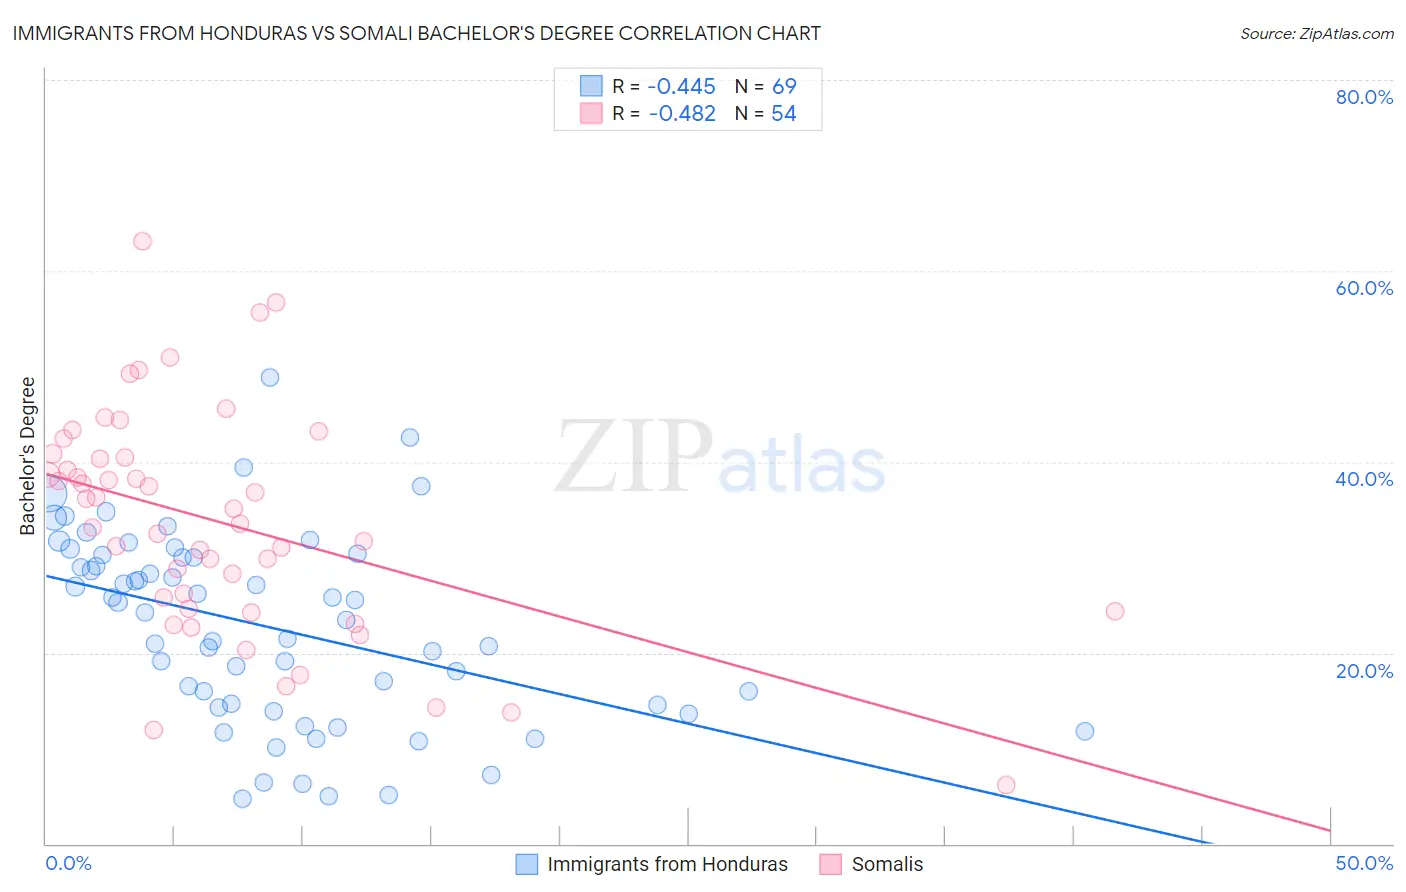
Immigrants from Honduras vs Somali Bachelor's Degree Correlation Chart
The statistical analysis conducted on geographies consisting of 322,614,162 people shows a moderate negative correlation between the proportion of Immigrants from Honduras and percentage of population with at least bachelor's degree education in the United States with a correlation coefficient (R) of -0.445 and weighted average of 30.9%. Similarly, the statistical analysis conducted on geographies consisting of 99,325,880 people shows a moderate negative correlation between the proportion of Somalis and percentage of population with at least bachelor's degree education in the United States with a correlation coefficient (R) of -0.482 and weighted average of 38.1%, a difference of 23.3%.
Bachelor's Degree Correlation Summary
| Measurement | Immigrants from Honduras | Somali |
| Minimum | 4.8% | 6.2% |
| Maximum | 48.9% | 63.1% |
| Range | 44.1% | 56.9% |
| Mean | 22.7% | 33.6% |
| Median | 24.2% | 34.3% |
| Interquartile 25% (IQ1) | 14.4% | 24.6% |
| Interquartile 75% (IQ3) | 30.1% | 40.5% |
| Interquartile Range (IQR) | 15.7% | 15.9% |
| Standard Deviation (Sample) | 9.9% | 11.8% |
| Standard Deviation (Population) | 9.8% | 11.7% |
Similar Demographics by Bachelor's Degree
Demographics Similar to Immigrants from Honduras by Bachelor's Degree
In terms of bachelor's degree, the demographic groups most similar to Immigrants from Honduras are Puerto Rican (31.0%, a difference of 0.040%), Black/African American (30.9%, a difference of 0.040%), Ute (30.9%, a difference of 0.12%), Guatemalan (31.0%, a difference of 0.18%), and Cape Verdean (30.9%, a difference of 0.21%).
| Demographics | Rating | Rank | Bachelor's Degree |
| Hondurans | 0.1 /100 | #283 | Tragic 31.3% |
| Haitians | 0.1 /100 | #284 | Tragic 31.3% |
| Aleuts | 0.1 /100 | #285 | Tragic 31.3% |
| Immigrants | El Salvador | 0.1 /100 | #286 | Tragic 31.3% |
| Ottawa | 0.1 /100 | #287 | Tragic 31.1% |
| Guatemalans | 0.1 /100 | #288 | Tragic 31.0% |
| Puerto Ricans | 0.1 /100 | #289 | Tragic 31.0% |
| Immigrants | Honduras | 0.1 /100 | #290 | Tragic 30.9% |
| Blacks/African Americans | 0.1 /100 | #291 | Tragic 30.9% |
| Ute | 0.1 /100 | #292 | Tragic 30.9% |
| Cape Verdeans | 0.1 /100 | #293 | Tragic 30.9% |
| Immigrants | Guatemala | 0.0 /100 | #294 | Tragic 30.8% |
| Immigrants | Dominican Republic | 0.0 /100 | #295 | Tragic 30.7% |
| Puget Sound Salish | 0.0 /100 | #296 | Tragic 30.7% |
| Immigrants | Haiti | 0.0 /100 | #297 | Tragic 30.6% |
Demographics Similar to Somalis by Bachelor's Degree
In terms of bachelor's degree, the demographic groups most similar to Somalis are Sri Lankan (38.2%, a difference of 0.050%), Scottish (38.1%, a difference of 0.21%), Danish (38.1%, a difference of 0.24%), Ghanaian (38.0%, a difference of 0.33%), and Hungarian (38.3%, a difference of 0.35%).
| Demographics | Rating | Rank | Bachelor's Degree |
| Chinese | 66.6 /100 | #159 | Good 38.5% |
| Vietnamese | 66.6 /100 | #160 | Good 38.5% |
| Uruguayans | 65.8 /100 | #161 | Good 38.4% |
| Colombians | 65.0 /100 | #162 | Good 38.4% |
| Peruvians | 63.4 /100 | #163 | Good 38.3% |
| Hungarians | 62.1 /100 | #164 | Good 38.3% |
| Sri Lankans | 59.1 /100 | #165 | Average 38.2% |
| Somalis | 58.6 /100 | #166 | Average 38.1% |
| Scottish | 56.6 /100 | #167 | Average 38.1% |
| Danes | 56.2 /100 | #168 | Average 38.1% |
| Ghanaians | 55.3 /100 | #169 | Average 38.0% |
| Czechs | 54.4 /100 | #170 | Average 38.0% |
| Bermudans | 54.2 /100 | #171 | Average 38.0% |
| Immigrants | Somalia | 52.8 /100 | #172 | Average 37.9% |
| Immigrants | Iraq | 52.5 /100 | #173 | Average 37.9% |