Cajun vs Somali Bachelor's Degree
COMPARE
Cajun
Somali
Bachelor's Degree
Bachelor's Degree Comparison
Cajuns
Somalis
29.6%
BACHELOR'S DEGREE
0.0/ 100
METRIC RATING
308th/ 347
METRIC RANK
38.1%
BACHELOR'S DEGREE
58.6/ 100
METRIC RATING
166th/ 347
METRIC RANK
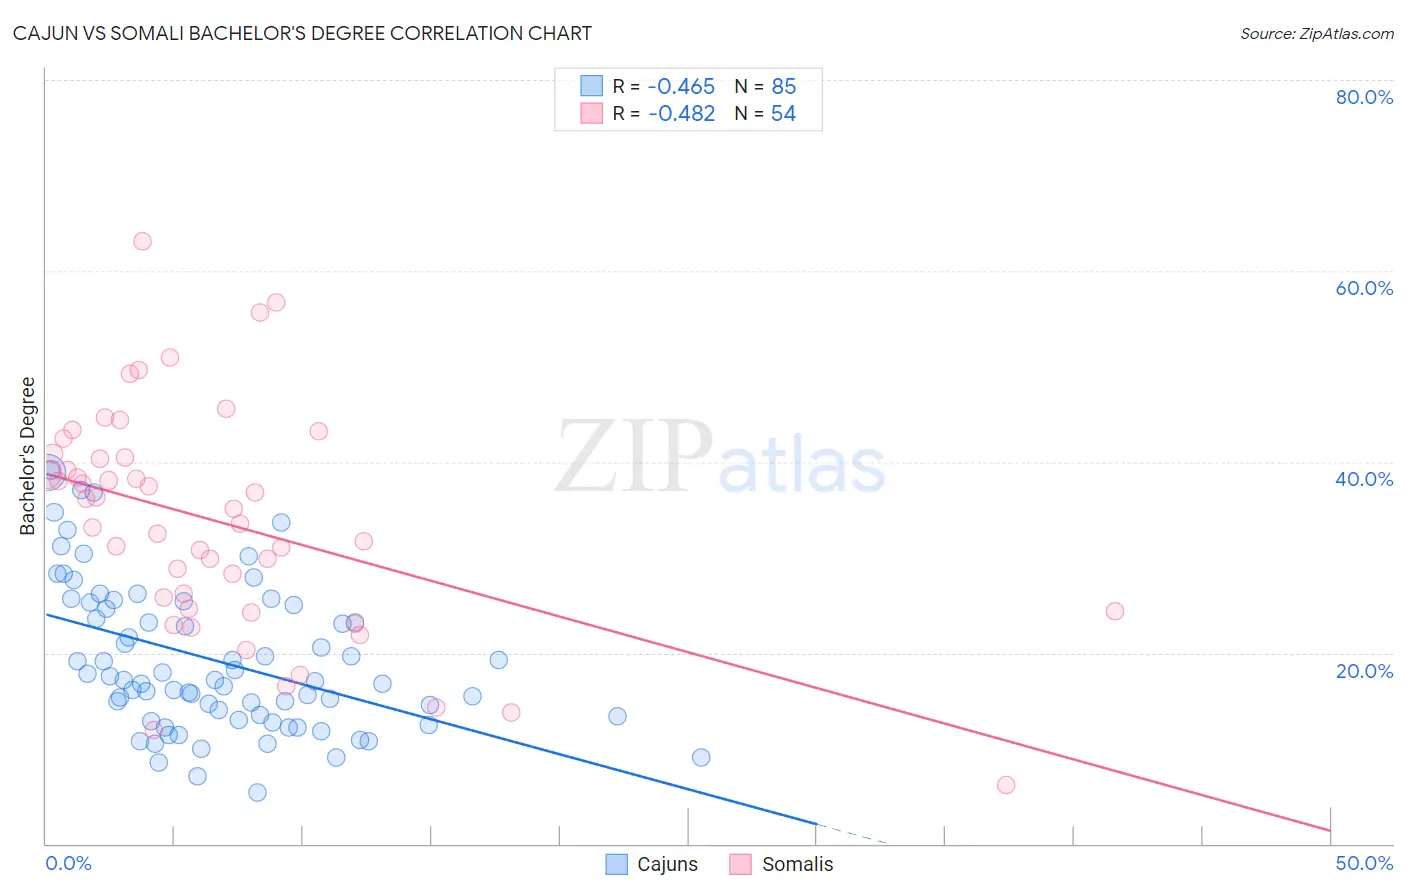
Cajun vs Somali Bachelor's Degree Correlation Chart
The statistical analysis conducted on geographies consisting of 149,707,155 people shows a moderate negative correlation between the proportion of Cajuns and percentage of population with at least bachelor's degree education in the United States with a correlation coefficient (R) of -0.465 and weighted average of 29.6%. Similarly, the statistical analysis conducted on geographies consisting of 99,325,880 people shows a moderate negative correlation between the proportion of Somalis and percentage of population with at least bachelor's degree education in the United States with a correlation coefficient (R) of -0.482 and weighted average of 38.1%, a difference of 28.7%.
Bachelor's Degree Correlation Summary
| Measurement | Cajun | Somali |
| Minimum | 5.4% | 6.2% |
| Maximum | 39.1% | 63.1% |
| Range | 33.8% | 56.9% |
| Mean | 19.2% | 33.6% |
| Median | 17.1% | 34.3% |
| Interquartile 25% (IQ1) | 13.2% | 24.6% |
| Interquartile 75% (IQ3) | 25.1% | 40.5% |
| Interquartile Range (IQR) | 11.9% | 15.9% |
| Standard Deviation (Sample) | 7.8% | 11.8% |
| Standard Deviation (Population) | 7.8% | 11.7% |
Similar Demographics by Bachelor's Degree
Demographics Similar to Cajuns by Bachelor's Degree
In terms of bachelor's degree, the demographic groups most similar to Cajuns are Hispanic or Latino (29.6%, a difference of 0.18%), Cheyenne (29.4%, a difference of 0.65%), Choctaw (29.4%, a difference of 0.72%), Seminole (29.4%, a difference of 0.78%), and Nepalese (29.9%, a difference of 0.86%).
| Demographics | Rating | Rank | Bachelor's Degree |
| Immigrants | Cuba | 0.0 /100 | #301 | Tragic 30.3% |
| Mexican American Indians | 0.0 /100 | #302 | Tragic 30.2% |
| Bangladeshis | 0.0 /100 | #303 | Tragic 30.2% |
| Cherokee | 0.0 /100 | #304 | Tragic 30.2% |
| Immigrants | Latin America | 0.0 /100 | #305 | Tragic 30.1% |
| Immigrants | Yemen | 0.0 /100 | #306 | Tragic 29.9% |
| Nepalese | 0.0 /100 | #307 | Tragic 29.9% |
| Cajuns | 0.0 /100 | #308 | Tragic 29.6% |
| Hispanics or Latinos | 0.0 /100 | #309 | Tragic 29.6% |
| Cheyenne | 0.0 /100 | #310 | Tragic 29.4% |
| Choctaw | 0.0 /100 | #311 | Tragic 29.4% |
| Seminole | 0.0 /100 | #312 | Tragic 29.4% |
| Alaska Natives | 0.0 /100 | #313 | Tragic 29.4% |
| Shoshone | 0.0 /100 | #314 | Tragic 29.3% |
| Immigrants | Cabo Verde | 0.0 /100 | #315 | Tragic 29.2% |
Demographics Similar to Somalis by Bachelor's Degree
In terms of bachelor's degree, the demographic groups most similar to Somalis are Sri Lankan (38.2%, a difference of 0.050%), Scottish (38.1%, a difference of 0.21%), Danish (38.1%, a difference of 0.24%), Ghanaian (38.0%, a difference of 0.33%), and Hungarian (38.3%, a difference of 0.35%).
| Demographics | Rating | Rank | Bachelor's Degree |
| Chinese | 66.6 /100 | #159 | Good 38.5% |
| Vietnamese | 66.6 /100 | #160 | Good 38.5% |
| Uruguayans | 65.8 /100 | #161 | Good 38.4% |
| Colombians | 65.0 /100 | #162 | Good 38.4% |
| Peruvians | 63.4 /100 | #163 | Good 38.3% |
| Hungarians | 62.1 /100 | #164 | Good 38.3% |
| Sri Lankans | 59.1 /100 | #165 | Average 38.2% |
| Somalis | 58.6 /100 | #166 | Average 38.1% |
| Scottish | 56.6 /100 | #167 | Average 38.1% |
| Danes | 56.2 /100 | #168 | Average 38.1% |
| Ghanaians | 55.3 /100 | #169 | Average 38.0% |
| Czechs | 54.4 /100 | #170 | Average 38.0% |
| Bermudans | 54.2 /100 | #171 | Average 38.0% |
| Immigrants | Somalia | 52.8 /100 | #172 | Average 37.9% |
| Immigrants | Iraq | 52.5 /100 | #173 | Average 37.9% |