British West Indian vs Somali Bachelor's Degree
COMPARE
British West Indian
Somali
Bachelor's Degree
Bachelor's Degree Comparison
British West Indians
Somalis
34.5%
BACHELOR'S DEGREE
2.5/ 100
METRIC RATING
239th/ 347
METRIC RANK
38.1%
BACHELOR'S DEGREE
58.6/ 100
METRIC RATING
166th/ 347
METRIC RANK
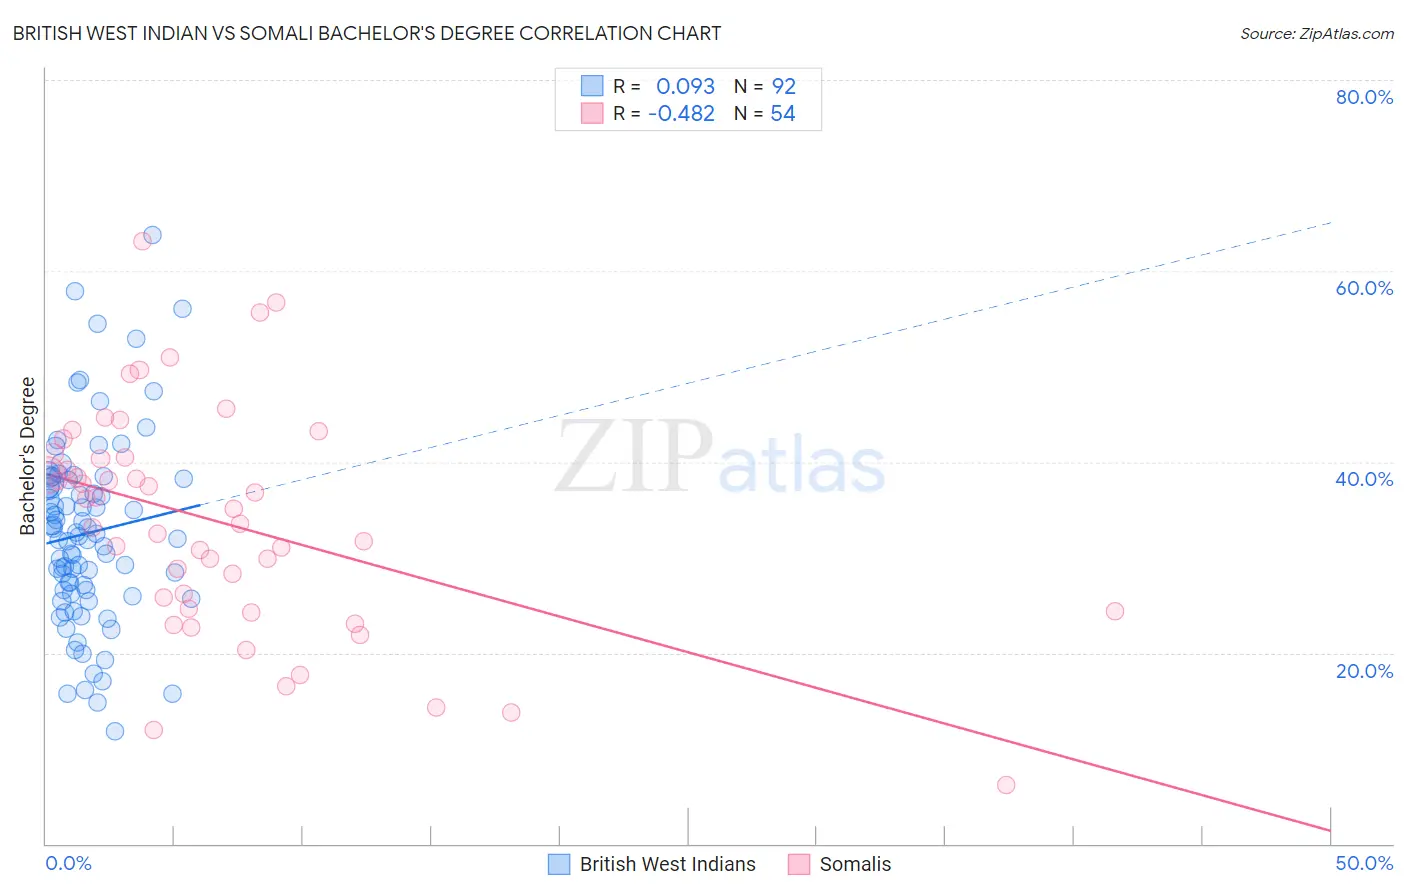
British West Indian vs Somali Bachelor's Degree Correlation Chart
The statistical analysis conducted on geographies consisting of 152,683,655 people shows a slight positive correlation between the proportion of British West Indians and percentage of population with at least bachelor's degree education in the United States with a correlation coefficient (R) of 0.093 and weighted average of 34.5%. Similarly, the statistical analysis conducted on geographies consisting of 99,325,880 people shows a moderate negative correlation between the proportion of Somalis and percentage of population with at least bachelor's degree education in the United States with a correlation coefficient (R) of -0.482 and weighted average of 38.1%, a difference of 10.7%.
Bachelor's Degree Correlation Summary
| Measurement | British West Indian | Somali |
| Minimum | 11.8% | 6.2% |
| Maximum | 63.7% | 63.1% |
| Range | 51.9% | 56.9% |
| Mean | 32.5% | 33.6% |
| Median | 32.0% | 34.3% |
| Interquartile 25% (IQ1) | 26.4% | 24.6% |
| Interquartile 75% (IQ3) | 38.0% | 40.5% |
| Interquartile Range (IQR) | 11.6% | 15.9% |
| Standard Deviation (Sample) | 9.8% | 11.8% |
| Standard Deviation (Population) | 9.7% | 11.7% |
Similar Demographics by Bachelor's Degree
Demographics Similar to British West Indians by Bachelor's Degree
In terms of bachelor's degree, the demographic groups most similar to British West Indians are Guyanese (34.5%, a difference of 0.020%), Tlingit-Haida (34.6%, a difference of 0.30%), Liberian (34.6%, a difference of 0.34%), Immigrants from West Indies (34.6%, a difference of 0.45%), and Guamanian/Chamorro (34.6%, a difference of 0.54%).
| Demographics | Rating | Rank | Bachelor's Degree |
| Hmong | 3.4 /100 | #232 | Tragic 34.8% |
| Immigrants | Ecuador | 3.3 /100 | #233 | Tragic 34.7% |
| Guamanians/Chamorros | 3.0 /100 | #234 | Tragic 34.6% |
| Immigrants | West Indies | 2.9 /100 | #235 | Tragic 34.6% |
| Liberians | 2.8 /100 | #236 | Tragic 34.6% |
| Tlingit-Haida | 2.8 /100 | #237 | Tragic 34.6% |
| Guyanese | 2.5 /100 | #238 | Tragic 34.5% |
| British West Indians | 2.5 /100 | #239 | Tragic 34.5% |
| Tongans | 2.0 /100 | #240 | Tragic 34.3% |
| Immigrants | Cambodia | 1.9 /100 | #241 | Tragic 34.2% |
| Immigrants | Nonimmigrants | 1.8 /100 | #242 | Tragic 34.2% |
| Immigrants | Guyana | 1.4 /100 | #243 | Tragic 33.9% |
| Delaware | 1.2 /100 | #244 | Tragic 33.8% |
| Immigrants | Fiji | 1.2 /100 | #245 | Tragic 33.7% |
| Jamaicans | 1.0 /100 | #246 | Tragic 33.6% |
Demographics Similar to Somalis by Bachelor's Degree
In terms of bachelor's degree, the demographic groups most similar to Somalis are Sri Lankan (38.2%, a difference of 0.050%), Scottish (38.1%, a difference of 0.21%), Danish (38.1%, a difference of 0.24%), Ghanaian (38.0%, a difference of 0.33%), and Hungarian (38.3%, a difference of 0.35%).
| Demographics | Rating | Rank | Bachelor's Degree |
| Chinese | 66.6 /100 | #159 | Good 38.5% |
| Vietnamese | 66.6 /100 | #160 | Good 38.5% |
| Uruguayans | 65.8 /100 | #161 | Good 38.4% |
| Colombians | 65.0 /100 | #162 | Good 38.4% |
| Peruvians | 63.4 /100 | #163 | Good 38.3% |
| Hungarians | 62.1 /100 | #164 | Good 38.3% |
| Sri Lankans | 59.1 /100 | #165 | Average 38.2% |
| Somalis | 58.6 /100 | #166 | Average 38.1% |
| Scottish | 56.6 /100 | #167 | Average 38.1% |
| Danes | 56.2 /100 | #168 | Average 38.1% |
| Ghanaians | 55.3 /100 | #169 | Average 38.0% |
| Czechs | 54.4 /100 | #170 | Average 38.0% |
| Bermudans | 54.2 /100 | #171 | Average 38.0% |
| Immigrants | Somalia | 52.8 /100 | #172 | Average 37.9% |
| Immigrants | Iraq | 52.5 /100 | #173 | Average 37.9% |