Scandinavian vs Immigrants from Burma/Myanmar Associate's Degree
COMPARE
Scandinavian
Immigrants from Burma/Myanmar
Associate's Degree
Associate's Degree Comparison
Scandinavians
Immigrants from Burma/Myanmar
46.9%
ASSOCIATE'S DEGREE
65.2/ 100
METRIC RATING
161st/ 347
METRIC RANK
43.7%
ASSOCIATE'S DEGREE
4.3/ 100
METRIC RATING
226th/ 347
METRIC RANK
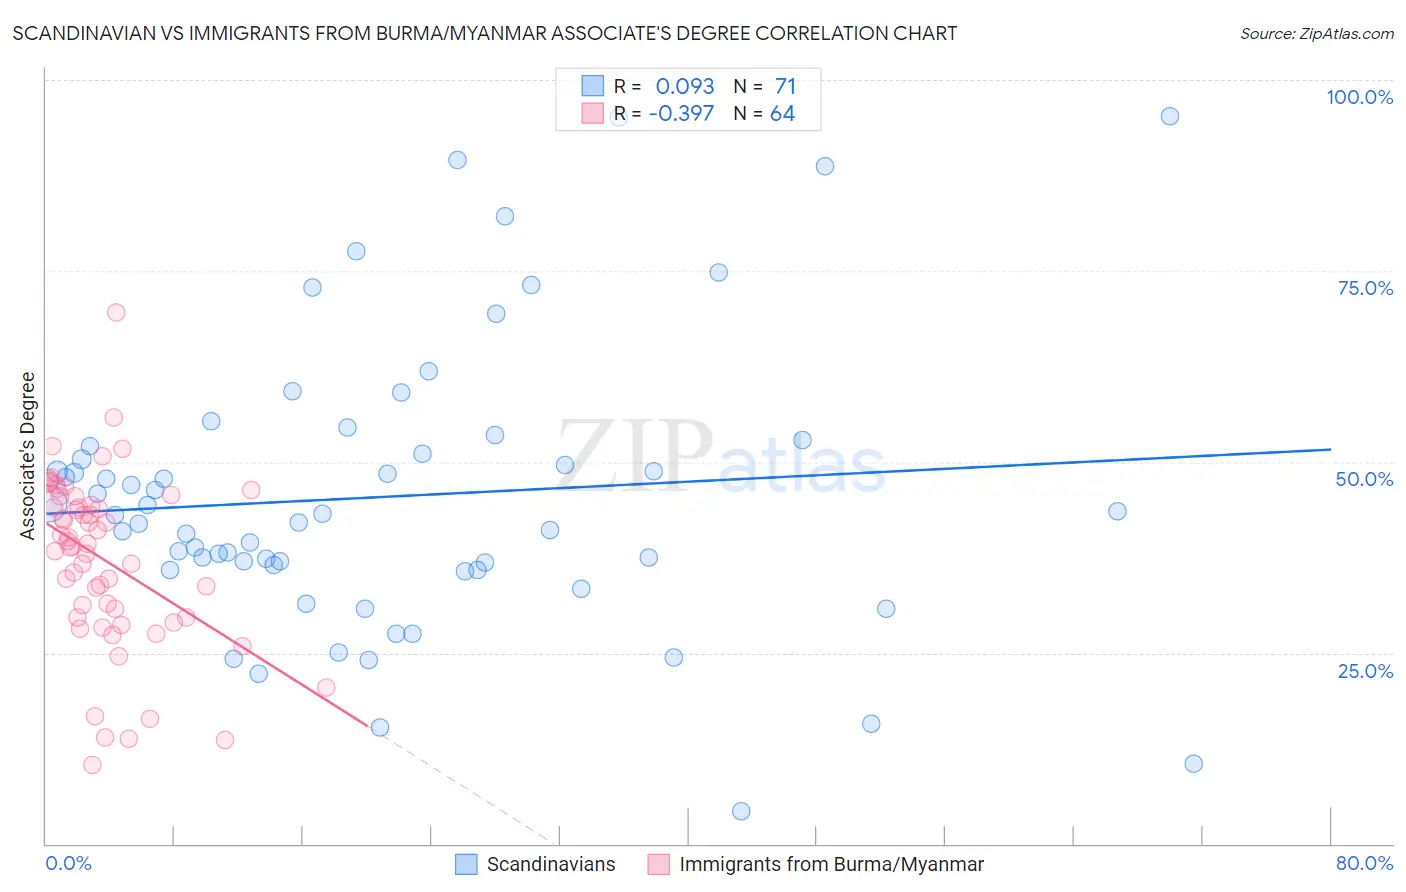
Scandinavian vs Immigrants from Burma/Myanmar Associate's Degree Correlation Chart
The statistical analysis conducted on geographies consisting of 472,632,829 people shows a slight positive correlation between the proportion of Scandinavians and percentage of population with at least associate's degree education in the United States with a correlation coefficient (R) of 0.093 and weighted average of 46.9%. Similarly, the statistical analysis conducted on geographies consisting of 172,341,560 people shows a mild negative correlation between the proportion of Immigrants from Burma/Myanmar and percentage of population with at least associate's degree education in the United States with a correlation coefficient (R) of -0.397 and weighted average of 43.7%, a difference of 7.4%.
Associate's Degree Correlation Summary
| Measurement | Scandinavian | Immigrants from Burma/Myanmar |
| Minimum | 4.2% | 10.2% |
| Maximum | 95.2% | 69.5% |
| Range | 91.0% | 59.3% |
| Mean | 45.5% | 37.2% |
| Median | 43.1% | 39.1% |
| Interquartile 25% (IQ1) | 35.9% | 29.7% |
| Interquartile 75% (IQ3) | 52.1% | 44.9% |
| Interquartile Range (IQR) | 16.2% | 15.2% |
| Standard Deviation (Sample) | 18.8% | 11.3% |
| Standard Deviation (Population) | 18.7% | 11.2% |
Similar Demographics by Associate's Degree
Demographics Similar to Scandinavians by Associate's Degree
In terms of associate's degree, the demographic groups most similar to Scandinavians are Scottish (46.9%, a difference of 0.020%), Immigrants from Africa (46.8%, a difference of 0.16%), Somali (46.8%, a difference of 0.22%), Colombian (46.8%, a difference of 0.23%), and Immigrants from Poland (47.1%, a difference of 0.33%).
| Demographics | Rating | Rank | Associate's Degree |
| Immigrants | Kenya | 72.1 /100 | #154 | Good 47.2% |
| Kenyans | 70.6 /100 | #155 | Good 47.1% |
| South Americans | 70.5 /100 | #156 | Good 47.1% |
| Sudanese | 70.3 /100 | #157 | Good 47.1% |
| Immigrants | Germany | 69.7 /100 | #158 | Good 47.1% |
| Immigrants | Poland | 69.2 /100 | #159 | Good 47.1% |
| Scottish | 65.4 /100 | #160 | Good 46.9% |
| Scandinavians | 65.2 /100 | #161 | Good 46.9% |
| Immigrants | Africa | 63.2 /100 | #162 | Good 46.8% |
| Somalis | 62.5 /100 | #163 | Good 46.8% |
| Colombians | 62.4 /100 | #164 | Good 46.8% |
| Immigrants | South America | 59.9 /100 | #165 | Average 46.7% |
| Hungarians | 59.3 /100 | #166 | Average 46.7% |
| Immigrants | Sierra Leone | 59.2 /100 | #167 | Average 46.7% |
| Immigrants | Somalia | 55.5 /100 | #168 | Average 46.5% |
Demographics Similar to Immigrants from Burma/Myanmar by Associate's Degree
In terms of associate's degree, the demographic groups most similar to Immigrants from Burma/Myanmar are Trinidadian and Tobagonian (43.6%, a difference of 0.17%), Guamanian/Chamorro (43.8%, a difference of 0.22%), West Indian (43.8%, a difference of 0.37%), Subsaharan African (43.9%, a difference of 0.51%), and Barbadian (43.9%, a difference of 0.61%).
| Demographics | Rating | Rank | Associate's Degree |
| Whites/Caucasians | 7.5 /100 | #219 | Tragic 44.2% |
| Portuguese | 7.2 /100 | #220 | Tragic 44.1% |
| Immigrants | Western Africa | 6.6 /100 | #221 | Tragic 44.1% |
| Barbadians | 5.8 /100 | #222 | Tragic 43.9% |
| Sub-Saharan Africans | 5.5 /100 | #223 | Tragic 43.9% |
| West Indians | 5.2 /100 | #224 | Tragic 43.8% |
| Guamanians/Chamorros | 4.8 /100 | #225 | Tragic 43.8% |
| Immigrants | Burma/Myanmar | 4.3 /100 | #226 | Tragic 43.7% |
| Trinidadians and Tobagonians | 4.0 /100 | #227 | Tragic 43.6% |
| Hmong | 3.2 /100 | #228 | Tragic 43.4% |
| Immigrants | Trinidad and Tobago | 3.0 /100 | #229 | Tragic 43.3% |
| Immigrants | Barbados | 2.9 /100 | #230 | Tragic 43.3% |
| Liberians | 2.9 /100 | #231 | Tragic 43.3% |
| Native Hawaiians | 2.3 /100 | #232 | Tragic 43.1% |
| Tongans | 2.2 /100 | #233 | Tragic 43.0% |