Scandinavian vs Immigrants from Burma/Myanmar 6th Grade
COMPARE
Scandinavian
Immigrants from Burma/Myanmar
6th Grade
6th Grade Comparison
Scandinavians
Immigrants from Burma/Myanmar
98.0%
6TH GRADE
100.0/ 100
METRIC RATING
28th/ 347
METRIC RANK
95.7%
6TH GRADE
0.0/ 100
METRIC RATING
302nd/ 347
METRIC RANK
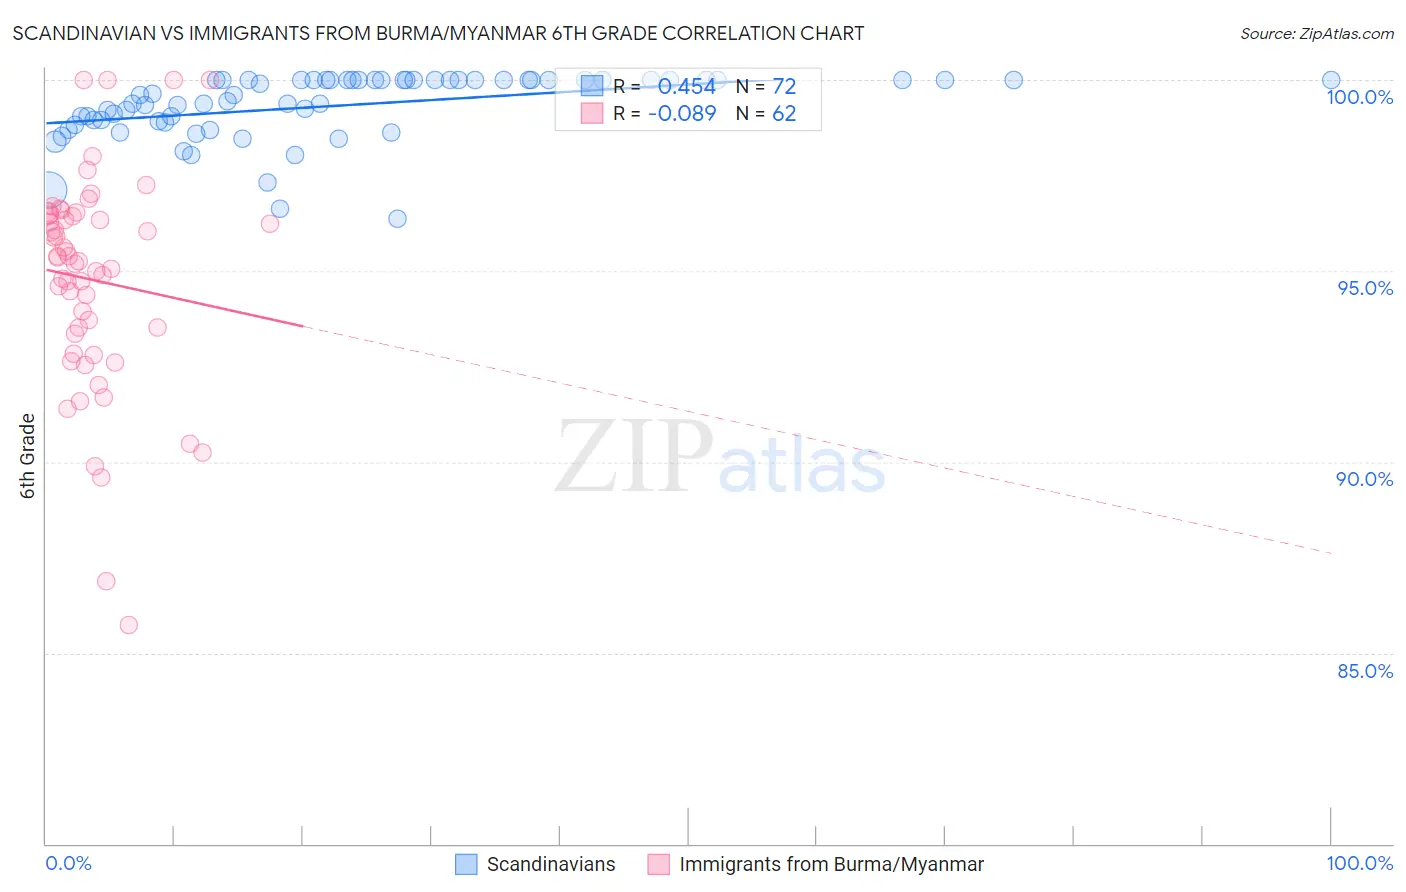
Scandinavian vs Immigrants from Burma/Myanmar 6th Grade Correlation Chart
The statistical analysis conducted on geographies consisting of 472,660,325 people shows a moderate positive correlation between the proportion of Scandinavians and percentage of population with at least 6th grade education in the United States with a correlation coefficient (R) of 0.454 and weighted average of 98.0%. Similarly, the statistical analysis conducted on geographies consisting of 172,326,083 people shows a slight negative correlation between the proportion of Immigrants from Burma/Myanmar and percentage of population with at least 6th grade education in the United States with a correlation coefficient (R) of -0.089 and weighted average of 95.7%, a difference of 2.4%.
6th Grade Correlation Summary
| Measurement | Scandinavian | Immigrants from Burma/Myanmar |
| Minimum | 96.4% | 85.7% |
| Maximum | 100.0% | 100.0% |
| Range | 3.6% | 14.3% |
| Mean | 99.3% | 94.8% |
| Median | 99.6% | 95.3% |
| Interquartile 25% (IQ1) | 98.9% | 93.4% |
| Interquartile 75% (IQ3) | 100.0% | 96.5% |
| Interquartile Range (IQR) | 1.1% | 3.1% |
| Standard Deviation (Sample) | 0.85% | 2.8% |
| Standard Deviation (Population) | 0.85% | 2.8% |
Similar Demographics by 6th Grade
Demographics Similar to Scandinavians by 6th Grade
In terms of 6th grade, the demographic groups most similar to Scandinavians are Czech (98.0%, a difference of 0.0%), Yup'ik (98.0%, a difference of 0.0%), French (98.0%, a difference of 0.0%), French Canadian (98.0%, a difference of 0.010%), and European (98.0%, a difference of 0.010%).
| Demographics | Rating | Rank | 6th Grade |
| Lithuanians | 100.0 /100 | #21 | Exceptional 98.1% |
| Danes | 100.0 /100 | #22 | Exceptional 98.0% |
| Sioux | 100.0 /100 | #23 | Exceptional 98.0% |
| Croatians | 100.0 /100 | #24 | Exceptional 98.0% |
| Scotch-Irish | 100.0 /100 | #25 | Exceptional 98.0% |
| Czechs | 100.0 /100 | #26 | Exceptional 98.0% |
| Yup'ik | 100.0 /100 | #27 | Exceptional 98.0% |
| Scandinavians | 100.0 /100 | #28 | Exceptional 98.0% |
| French | 100.0 /100 | #29 | Exceptional 98.0% |
| French Canadians | 100.0 /100 | #30 | Exceptional 98.0% |
| Europeans | 100.0 /100 | #31 | Exceptional 98.0% |
| Alaska Natives | 100.0 /100 | #32 | Exceptional 98.0% |
| Chippewa | 100.0 /100 | #33 | Exceptional 97.9% |
| Swiss | 100.0 /100 | #34 | Exceptional 97.9% |
| Chinese | 100.0 /100 | #35 | Exceptional 97.9% |
Demographics Similar to Immigrants from Burma/Myanmar by 6th Grade
In terms of 6th grade, the demographic groups most similar to Immigrants from Burma/Myanmar are Immigrants from Dominica (95.7%, a difference of 0.020%), Immigrants (95.7%, a difference of 0.020%), Immigrants from Laos (95.7%, a difference of 0.030%), Sri Lankan (95.8%, a difference of 0.050%), and Bangladeshi (95.7%, a difference of 0.070%).
| Demographics | Rating | Rank | 6th Grade |
| Immigrants | Grenada | 0.0 /100 | #295 | Tragic 95.9% |
| Immigrants | South Eastern Asia | 0.0 /100 | #296 | Tragic 95.9% |
| Haitians | 0.0 /100 | #297 | Tragic 95.8% |
| Sri Lankans | 0.0 /100 | #298 | Tragic 95.8% |
| Immigrants | Laos | 0.0 /100 | #299 | Tragic 95.7% |
| Immigrants | Dominica | 0.0 /100 | #300 | Tragic 95.7% |
| Immigrants | Immigrants | 0.0 /100 | #301 | Tragic 95.7% |
| Immigrants | Burma/Myanmar | 0.0 /100 | #302 | Tragic 95.7% |
| Bangladeshis | 0.0 /100 | #303 | Tragic 95.7% |
| Indonesians | 0.0 /100 | #304 | Tragic 95.6% |
| Immigrants | Cuba | 0.0 /100 | #305 | Tragic 95.6% |
| Immigrants | Haiti | 0.0 /100 | #306 | Tragic 95.6% |
| Guyanese | 0.0 /100 | #307 | Tragic 95.6% |
| Immigrants | Caribbean | 0.0 /100 | #308 | Tragic 95.6% |
| Puerto Ricans | 0.0 /100 | #309 | Tragic 95.5% |