Scandinavian vs Immigrants from Korea Associate's Degree
COMPARE
Scandinavian
Immigrants from Korea
Associate's Degree
Associate's Degree Comparison
Scandinavians
Immigrants from Korea
46.9%
ASSOCIATE'S DEGREE
65.2/ 100
METRIC RATING
161st/ 347
METRIC RANK
54.5%
ASSOCIATE'S DEGREE
100.0/ 100
METRIC RATING
24th/ 347
METRIC RANK
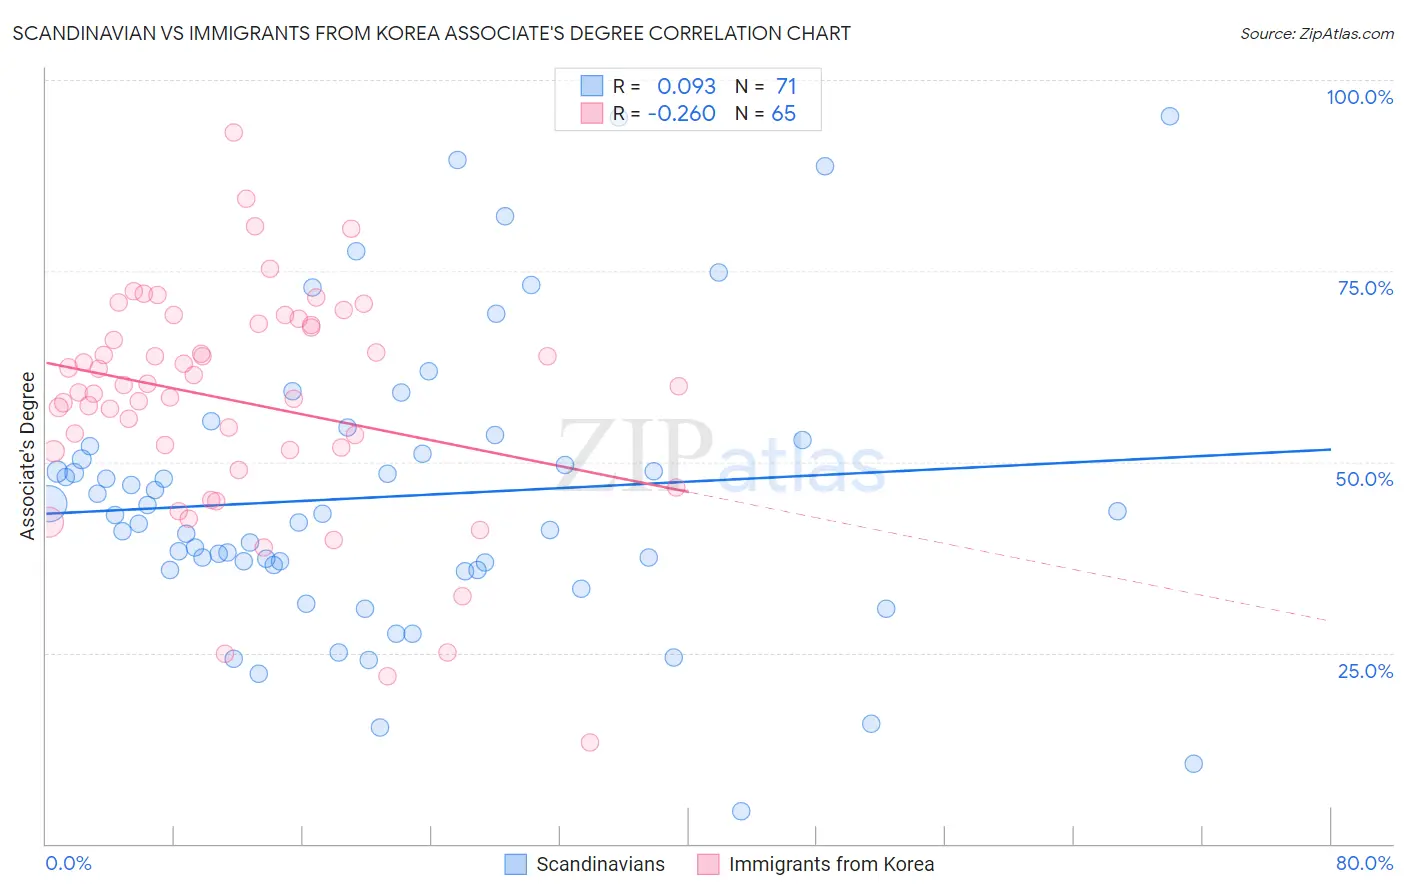
Scandinavian vs Immigrants from Korea Associate's Degree Correlation Chart
The statistical analysis conducted on geographies consisting of 472,632,829 people shows a slight positive correlation between the proportion of Scandinavians and percentage of population with at least associate's degree education in the United States with a correlation coefficient (R) of 0.093 and weighted average of 46.9%. Similarly, the statistical analysis conducted on geographies consisting of 416,302,592 people shows a weak negative correlation between the proportion of Immigrants from Korea and percentage of population with at least associate's degree education in the United States with a correlation coefficient (R) of -0.260 and weighted average of 54.5%, a difference of 16.3%.
Associate's Degree Correlation Summary
| Measurement | Scandinavian | Immigrants from Korea |
| Minimum | 4.2% | 13.3% |
| Maximum | 95.2% | 93.1% |
| Range | 91.0% | 79.9% |
| Mean | 45.5% | 57.9% |
| Median | 43.1% | 59.9% |
| Interquartile 25% (IQ1) | 35.9% | 51.4% |
| Interquartile 75% (IQ3) | 52.1% | 68.0% |
| Interquartile Range (IQR) | 16.2% | 16.5% |
| Standard Deviation (Sample) | 18.8% | 14.9% |
| Standard Deviation (Population) | 18.7% | 14.8% |
Similar Demographics by Associate's Degree
Demographics Similar to Scandinavians by Associate's Degree
In terms of associate's degree, the demographic groups most similar to Scandinavians are Scottish (46.9%, a difference of 0.020%), Immigrants from Africa (46.8%, a difference of 0.16%), Somali (46.8%, a difference of 0.22%), Colombian (46.8%, a difference of 0.23%), and Immigrants from Poland (47.1%, a difference of 0.33%).
| Demographics | Rating | Rank | Associate's Degree |
| Immigrants | Kenya | 72.1 /100 | #154 | Good 47.2% |
| Kenyans | 70.6 /100 | #155 | Good 47.1% |
| South Americans | 70.5 /100 | #156 | Good 47.1% |
| Sudanese | 70.3 /100 | #157 | Good 47.1% |
| Immigrants | Germany | 69.7 /100 | #158 | Good 47.1% |
| Immigrants | Poland | 69.2 /100 | #159 | Good 47.1% |
| Scottish | 65.4 /100 | #160 | Good 46.9% |
| Scandinavians | 65.2 /100 | #161 | Good 46.9% |
| Immigrants | Africa | 63.2 /100 | #162 | Good 46.8% |
| Somalis | 62.5 /100 | #163 | Good 46.8% |
| Colombians | 62.4 /100 | #164 | Good 46.8% |
| Immigrants | South America | 59.9 /100 | #165 | Average 46.7% |
| Hungarians | 59.3 /100 | #166 | Average 46.7% |
| Immigrants | Sierra Leone | 59.2 /100 | #167 | Average 46.7% |
| Immigrants | Somalia | 55.5 /100 | #168 | Average 46.5% |
Demographics Similar to Immigrants from Korea by Associate's Degree
In terms of associate's degree, the demographic groups most similar to Immigrants from Korea are Immigrants from Switzerland (54.5%, a difference of 0.030%), Immigrants from Belgium (54.5%, a difference of 0.070%), Immigrants from Japan (54.6%, a difference of 0.090%), Burmese (54.6%, a difference of 0.090%), and Immigrants from Sweden (54.6%, a difference of 0.12%).
| Demographics | Rating | Rank | Associate's Degree |
| Eastern Europeans | 100.0 /100 | #17 | Exceptional 55.0% |
| Indians (Asian) | 100.0 /100 | #18 | Exceptional 54.8% |
| Immigrants | Ireland | 100.0 /100 | #19 | Exceptional 54.7% |
| Cambodians | 100.0 /100 | #20 | Exceptional 54.6% |
| Immigrants | Sweden | 100.0 /100 | #21 | Exceptional 54.6% |
| Immigrants | Japan | 100.0 /100 | #22 | Exceptional 54.6% |
| Burmese | 100.0 /100 | #23 | Exceptional 54.6% |
| Immigrants | Korea | 100.0 /100 | #24 | Exceptional 54.5% |
| Immigrants | Switzerland | 100.0 /100 | #25 | Exceptional 54.5% |
| Immigrants | Belgium | 100.0 /100 | #26 | Exceptional 54.5% |
| Latvians | 100.0 /100 | #27 | Exceptional 53.9% |
| Turks | 100.0 /100 | #28 | Exceptional 53.9% |
| Immigrants | France | 100.0 /100 | #29 | Exceptional 53.9% |
| Immigrants | Sri Lanka | 100.0 /100 | #30 | Exceptional 53.7% |
| Immigrants | Northern Europe | 100.0 /100 | #31 | Exceptional 53.5% |